. 2021 May 19;13(10):2473.
doi: 10.3390/cancers13102473.

Exploring the Complementarity of Pancreatic Ductal Adenocarcinoma Preclinical Models

Affiliations

Exploring the Complementarity of Pancreatic Ductal Adenocarcinoma Preclinical Models

Owen Hoare et al. Cancers (Basel). .

Abstract

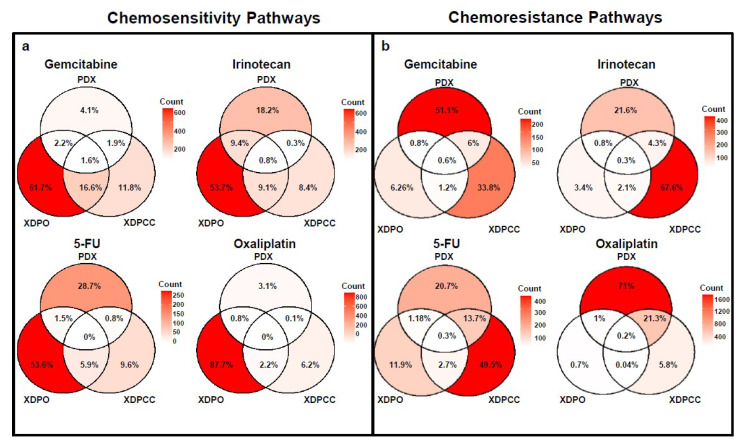
Purpose: Compare pancreatic ductal adenocarcinoma (PDAC), preclinical models, by their transcriptome and drug response landscapes to evaluate their complementarity. Experimental Design: Three paired PDAC preclinical models-patient-derived xenografts (PDX), xenograft-derived pancreatic organoids (XDPO) and xenograft-derived primary cell cultures (XDPCC)-were derived from 20 patients and analyzed at the transcriptomic and chemosensitivity level. Transcriptomic characterization was performed using the basal-like/classical subtyping and the PDAC molecular gradient (PAMG). Chemosensitivity for gemcitabine, irinotecan, 5-fluorouracil and oxaliplatin was established and the associated biological pathways were determined using independent component analysis (ICA) on the transcriptome of each model. The selection criteria used to identify the different components was the chemosensitivity score (CSS) found for each drug in each model. Results: PDX was the most dispersed model whereas XDPO and XDPCC were mainly classical and basal-like, respectively. Chemosensitivity scoring determines that PDX and XDPO display a positive correlation for three out of four drugs tested, whereas PDX and XDPCC did not correlate. No match was observed for each tumor chemosensitivity in the different models. Finally, pathway analysis shows a significant association between PDX and XDPO for the chemosensitivity-associated pathways and PDX and XDPCC for the chemoresistance-associated pathways. Conclusions: Each PDAC preclinical model possesses a unique basal-like/classical transcriptomic phenotype that strongly influences their global chemosensitivity. Each preclinical model is imperfect but complementary, suggesting that a more representative approach of the clinical reality could be obtained by combining them. Translational Relevance: The identification of molecular signatures that underpin drug sensitivity to chemotherapy in PDAC remains clinically challenging. Importantly, the vast majority of studies using preclinical in vivo and in vitro models fail when transferred to patients in a clinical setting despite initially promising results. This study presents for the first time a comparison between three preclinical models directly derived from the same patients. We show that their applicability to preclinical studies should be considered with a complementary focus, avoiding tumor-based direct extrapolations, which might generate misleading conclusions and consequently the overlook of clinically relevant features.

Keywords: chemosensitivity prediction; in vitro models; in vivo models; pancreatic cancer; personalized medicine.


Conflict of interest statement

N.F. (Nicolas Fraunhoffer), J.I. and N.J.D. have a pending patent entitled “Simple transcriptomic signatures to determine chemosensitivity for pancreatic ductal adenocarcinoma”. C.M. (Caroline Mignard) and O.D. are employees of Oncodesign. C.M. (Colin McGuckin) and N.F. (Nico Forraz) are employees of CTIBIOTECH. S.B. is employees of Ipsen Innovation. All other authors declare no competing interests.

Figures

Figure 1
Figure 1
Study workflow. 20 PDAC tumors including surgical resections and fine needle aspirated (FNE) biopsy were subcutaneously transplanted in mice and allowed to grow. From these 20 PDX samples, XDPO and XDPCC were also derived and amplified in culture. Mice were later treated with chemotherapeutics, which were administered intravenously into the tail vein of the mouse. Measurements were taken periodically at set time intervals using a caliper device. Chemosensitivity testing was performed on PDX, XDPO and XDPCC samples and each model also underwent RNA-sequencing for further transcriptional downstream analysis.
Figure 2
Figure 2
Phenotypic analysis of PDX, XDPO and XDPCC. (a) A PCA plot was generated with the top 634 basal-like and classical markers across all three models. (b) Density plot showing the distribution of the PAMG across all three models. (c) Boxplot and Wilcoxon t-test illustrating the PAMG profile of each model examined. (d) ComplexHeatmap with correlation matrix using the 634 top basal-like and classical markers. Annotations to the left and right of the heatmap indicate, the Molecular Grade (PAMG), the PurIST classification and the model type. (e) Ranking of the Molecular Gradient (PAMG) across all three models from highest to lowest. Higher values indicate more classical and lower values indicate more basal-like. (f) Correlation co-efficient plots generated comparing all models using the PAMG, regression values and p-values.
Figure 3
Figure 3
Chemosensitivity score for PDX, XDPO and XDPCC. (a) Barplots were generated comparing the chemosensitivity score (CSS) of all models (IMOP01–IMOP20) treated with gemcitabine, irinotecan, 5-FU, and oxaliplatin respectively. Bars in red with a higher CSS indicate more resistance and bars in green with a lower CSS indicate more sensitivity. Non-available (NA) values for some models show no bars. (b) Correlation plots comparing the drug sensitivity profile and mean doubling time of all models for gemcitabine, irinotecan, 5-FU, and oxaliplatin. Statistically significant correlations are highlighted in blue squares as p-values of 0.05 or less.
Figure 4
Figure 4
Gemcitabine chemosensitivity profiles using ICA. (a) Correlation graph between the best component obtained from the ICA and gemcitabine CSS for PDX, XDPO and XDPCC models. The CSS is displayed on the y-axis and the contribution of the witness gene of the x-axis. All three models show an anti-correlation. Regression (R) values and p-values are displayed. (b) Hierarchical clustering for PDX, XDPO and XDPCC gemcitabine sensitivity components are shown respectively. Rows are clustered using model IDs and columns show the clustering of genes. Boxplots located at the bottom of the heatmap show the variation in expression levels for each gene within the component. Annotations to the right and left of the heatmap indicate, the Molecular Grade (PAMG), the PurIST classification and the model type including CSS. A higher CSS indicates more resistance in red and a lower CSS indicates more sensitivity in green. For the Molecular Gradient (PAMG) a higher value means a more classical phenotype (blue) and lower values are a more basal-like phenotype (red). Binary classification is also provided using the PurIST method for determining the phenotype where red is basal-like and blue is classical.
Figure 5
Figure 5
Molecular pathway analysis. Venn diagrams of all molecular pathways in common with all three models. (a) chemosensitivity associated pathways, (b) chemoresistance associated pathways. Count legend to the right depicts the number of pathways in common between models. The percentages are also included.

References

    1. Rawla P., Sunkara T., Gaduputi V. Epidemiology of Pancreatic Cancer: Global Trends, Etiology and Risk Factors. World J. Oncol. 2019;10:10–27. doi: 10.14740/wjon1166. - DOI - PMC - PubMed
    1. Klein A.P. Pancreatic cancer: A growing burden. Lancet Gastroenterol. Hepatol. 2019;12:895–896. doi: 10.1016/S2468-1253(19)30323-1. - DOI - PMC - PubMed
    1. Hidalgo M., Cascinu S., Kleeff J., Labianca R., Löhr J.M., Neoptolemos J., Real F.X., Van Laethem J.-L., Heinemann V. Addressing the challenges of pancreatic cancer: Future directions for improving outcomes. Pancreatology. 2015;15:8–18. doi: 10.1016/j.pan.2014.10.001. - DOI - PubMed
    1. Benzel J., Fendrich V. Familial pancreatic cancer. Oncol. Res. Treat. 2018;41:611–618. doi: 10.1159/000493473. - DOI - PubMed
    1. Mizrahi J.D., Surana R., Valle J.W., Shroff R.T. Pancreatic cancer. Lancet. 2020;39:2008–2020. doi: 10.1016/S0140-6736(20)30974-0. - DOI - PubMed

LinkOut - more resources