. 2021 May 19;22(10):5361.
doi: 10.3390/ijms22105361.

A 3D Renal Proximal Tubule on Chip Model Phenocopies Lowe Syndrome and Dent II Disease Tubulopathy

Affiliations

A 3D Renal Proximal Tubule on Chip Model Phenocopies Lowe Syndrome and Dent II Disease Tubulopathy

Sindhu Naik et al. Int J Mol Sci. .

Abstract

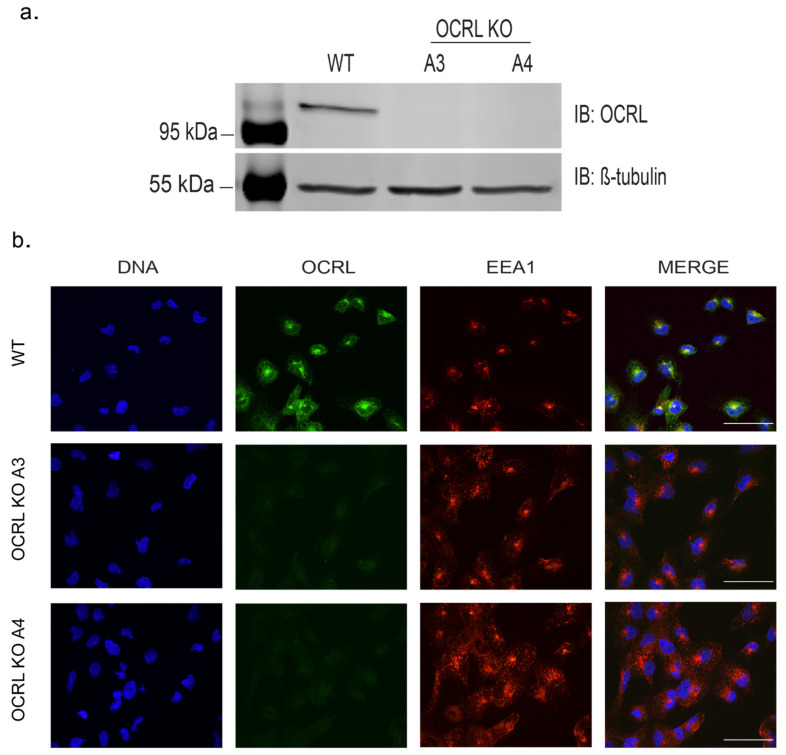
Lowe syndrome and Dent II disease are X-linked monogenetic diseases characterised by a renal reabsorption defect in the proximal tubules and caused by mutations in the OCRL gene, which codes for an inositol-5-phosphatase. The life expectancy of patients suffering from Lowe syndrome is largely reduced because of the development of chronic kidney disease and related complications. There is a need for physiological human in vitro models for Lowe syndrome/Dent II disease to study the underpinning disease mechanisms and to identify and characterise potential drugs and drug targets. Here, we describe a proximal tubule organ on chip model combining a 3D tubule architecture with fluid flow shear stress that phenocopies hallmarks of Lowe syndrome/Dent II disease. We demonstrate the high suitability of our in vitro model for drug target validation. Furthermore, using this model, we demonstrate that proximal tubule cells lacking OCRL expression upregulate markers typical for epithelial-mesenchymal transition (EMT), including the transcription factor SNAI2/Slug, and show increased collagen expression and deposition, which potentially contributes to interstitial fibrosis and disease progression as observed in Lowe syndrome and Dent II disease.

Keywords: Lowe syndrome; OCRL; disease modeling; fibrosis; microfluidic; organ-on-a-chip; proximal tubule-on-a-chip.


Conflict of interest statement

H.L.L. is an employee of Mimetas BV, which markets the OrganoPlate. OrganoPlate is a registered trademark of Mimetas BV. The authors have no additional financial interests.

Figures

Figure 1
Figure 1
Confirmation of OCRL KO stable cell lines: (a) Western blotting with Anti-OCRL–No OCRL protein was detected in A3 or A4, but WT shows the band at the predicted size of 110 kDa. Anti-β tubulin at 55 kDa was used as a loading control. (b) Immunostaining of WT and KO clones with Anti-OCRL and EEA1 (early endosomes) showing no punctate staining for OCRL in KO clones (A3 and A4). Images were taken by Airyscan confocal microscope, scale bars: 20 µm.
Figure 2
Figure 2
Proximal tubule on a chip: (a) 3-lane OrganoPlate® with 40 chips, a pictorial representation of a single chip with all its wells (A: cell inlet, B: gel inlet, C: medium inlet, D: cells outlet, E: gel outlet, F: medium outlet and G: observation window). The observation window (G) with the top lane shows when cells adhere against the gel in the middle lane followed by cells forming a tubule at Day 5. (b) Immunostaining images of the 3D proximal tubule grown in OrganoPlate with acetylated tubulin (green); scale bar: 500 µm.
Figure 3
Figure 3
Barrier integrity assay: (a) a cartoon of the 3-lane OrganoPlate microfluidic chips with a top perfusion channel with cells, middle gel channel and bottom medium channel. When dye-containing medium was added in the lumen, the dye did not permeate into the gel channel if the tubule was leak tight. (b) If the tubule was leaky or in cell-free control chips, the dye diffused into the gel channel. (c) Images of the leak-tight tubules of HK-2 cells in WT and OCRL KO clones (A3 and A4) vs. a cell-free control for leakiness for both 20 kDa FITC Dextran and 155 kDa TRITC Dextran molecules. (d,e) Graphs showing the curve for the cell-free control chip with the diffusion of the dye and its normalised fluorescence intensity increasing over the duration of the assay (14 min). Leak-tight tubules had stable ratios of signal intensities in the perfusion channel vs. the gel channel. The XY graph was plotted with the mean and SD values, N = 3. Each N had values from at least 5 chips per sample.
Figure 4
Figure 4
Cilia defect in Lowe syndrome cells under fluid flow: (a) immunofluorescence images showing HK-2 cells (WT and OCRL KO (A3, A4)) grown in OrganoPlate and stained with acetylated tubulin and PCNT to visualise primary cilia (green) and pericentrin (orange), respectively. Images were captured using the Perkin Elmer Operetta CLS with 20X water objective. Two adjacent fields were stitched together for visual purposes of the tubule. (b) Quantitative analysis of cilia length measured using segmented tool in ImageJ software and represented as a scatter plot with individual values. Ordinary one-way ANOVA and Dunnett’s multiple comparison test, N = 3 (>50 cells per N). ***, p < 0.001; ****, p < 0.0001, error bar represents mean with ± SEM.
Figure 5
Figure 5
Cilia length defect in OCRL-KO cells was rescued by PIP5K1A KD: (a) Capillary-based Western blotting (WES) confirming a reduction in protein expression levels of the PIP5K1A gene in WT, OCRL KO A3 and A4. The first lane depicts the biotinylated ladder at 66 kDa. The bands detected by the PIP5K1A antibody with samples of non-targeting siRNA CTRL show a distinct band at ~65 kDa. TBP (TATA-Box Binding Protein) was used as a loading marker and detected at ~52 kDa. Images were derived from the Simple Western Compass software and used to analyse data generated by WES. (b) An aligned dot plot with the length of cilia measured in each condition with ImageJ software segment tool. Student Welch’s t-test, N = 3 (>50 cells per N), ****, p < 0.0001, error bar represents ± SD. (c) Immunofluorescence images showing primary cilia stained with acetylated tubulin (green), pericentrin (red) and nucleus (blue) in WT, OCRL KO (A3 and A4) in PIP5K1A KD samples compared with their respective NT CTRL samples. Scale bar: 100 um.
Figure 6
Figure 6
Differential gene expression: (a) volcano plot showing differentially expressed genes with a cut off of 0.5, and ECM- and EMT-related genes validated by qPCR are highlighted. (b) Gene Ontology (GO) terms filtered according to 161 differentially expressed genes. The highest score of 32.38, in blue, is the extracellular matrix in the cellular component. 17 (267)—17 genes on our list matched 267 known dysregulated genes in the extracellular matrix cellular component. (c) Other upregulated genes confirmed by qPCR. Relative gene expression was calculated by 2ΔΔCt with appropriate housekeeping genes. (d) SNAI2 expression was upregulated in the absence of OCRL, and the gene expression levels were reduced with the re-introduction of OCRL–GFP into the cells. Ordinary one-way ANOVA and Dunnett’s multiple comparison test, N = 3 (>50 cells per N). *, p < 0.05; **, p < 0.01; ***, p < 0.001; ****, p < 0.0001, error bar represents mean with ± SEM.
Figure 7
Figure 7
Collagen secretion: (a) the scheme of the FRET assay used to measure the levels of pro-collagen I in supernatants of cultured cells. (b) 3D experiment: graph showing quantitative analysis of collagen secretion measured via FRET assay in cultured cells’ supernatants. Ordinary one-way ANOVA and Dunnett’s multiple comparison test, N = 3 (>50 cells per N), ****, p < 0.0001, error bars represent mean with ± SD. (c) Western blot showing the expression of GFP-tagged OCRL at approximately 135 kDa in OCRL KO clones with respect to HK-2 WT cell, with the expression of OCRL at approximately 110 kDa. (d) Graph showing the quantitative analysis of collagen secretion measured via FRET assay in cultured cells’ supernatants. Rescue cell lines showing decreased collagen secretion with respect to WT and a scatter dot plot showing the mean with SD, N = 2.
Figure 8
Figure 8
Collagen deposition: (a) 2D experiment: Immunofluorescence images captured by an InCell 6000 when cells were cultured for 7 days and stained with Col 1 antibody without permeabilising the cells to stain for ECM deposition (green). Scale bar: 5 µm. (b) 2D experiment: Graph showing increased ratio of cells with fibrous structures in OCRL KO cells when stained for collagen. (c) 2D experiment: graph showing increased collagen fibres deposited on OCRL KO cells measured by normalising the collagen staining intensity by the number of cells. Ordinary one-way ANOVA and Dunnett’s multiple comparison test, N = 3 (>50 cells per N), ***, p < 0.001; ****, p < 0.0001, error bar represents the mean with ± SEM.

Similar articles

Cited by

References

    1. Lowe C., Terrey M., MacLachlan E.A. Organic-Aciduria, Decreased Renal Ammonia Production, Hydrophthalmos, And Mental Retardationa Clinical Entity. Arch. Pediatr. Adolesc. Med. 1952;83:164. doi: 10.1001/archpedi.1952.02040060030004. - DOI - PubMed
    1. Attree O., Olivos I.M., Okabe I., Bailey L.C., Nelson D.L., Lewis R.A., Mclnnes R.R., Nussbaum R.L. The Lowe’s oculocerebrorenal syndrome gene encodes a protein highly homologous to inositol polyphosphate-5-phosphatase. Nat. Cell Biol. 1992;358:239–242. doi: 10.1038/358239a0. - DOI - PubMed
    1. Hoopes R.R., Shrimpton A.E., Knohl S.J., Hueber P., Hoppe B., Matyus J., Simckes A., Tasic V., Toenshoff B., Suchy S.F., et al. Dent Disease with Mutations in OCRL1. Am. J. Hum. Genet. 2005;76:260–267. doi: 10.1086/427887. - DOI - PMC - PubMed
    1. Böckenhauer D., Bökenkamp A., Nuutinen M., Unwin R., Hoff W.V., Sirimanna T., Vrljicak K., Ludwig M. Novel OCRL mutations in patients with Dent-2 disease. J. Pediatr. Genet. 2015;1:015–023. doi: 10.3233/PGE-2012-005. - DOI - PMC - PubMed
    1. Zaniew M., Bökenkamp A., Niemirska A., Bürger J., Rogowska-Kalisz A., Gellermann J., Zampetoglou A., Roszak M., Moczko J., Krzemień A., et al. Long-term renal outcome in children withOCRLmutations: Retrospective analysis of a large international cohort. Nephrol. Dial. Transplant. 2016;33:85–94. doi: 10.1093/ndt/gfw350. - DOI - PubMed

MeSH terms

Substances

Supplementary concepts