. 2021 May 19;11(5):329.
doi: 10.3390/metabo11050329.

Iron-Bound Lipocalin-2 Protects Renal Cell Carcinoma from Ferroptosis

Affiliations

Iron-Bound Lipocalin-2 Protects Renal Cell Carcinoma from Ferroptosis

Julia K Meier et al. Metabolites. .

Abstract

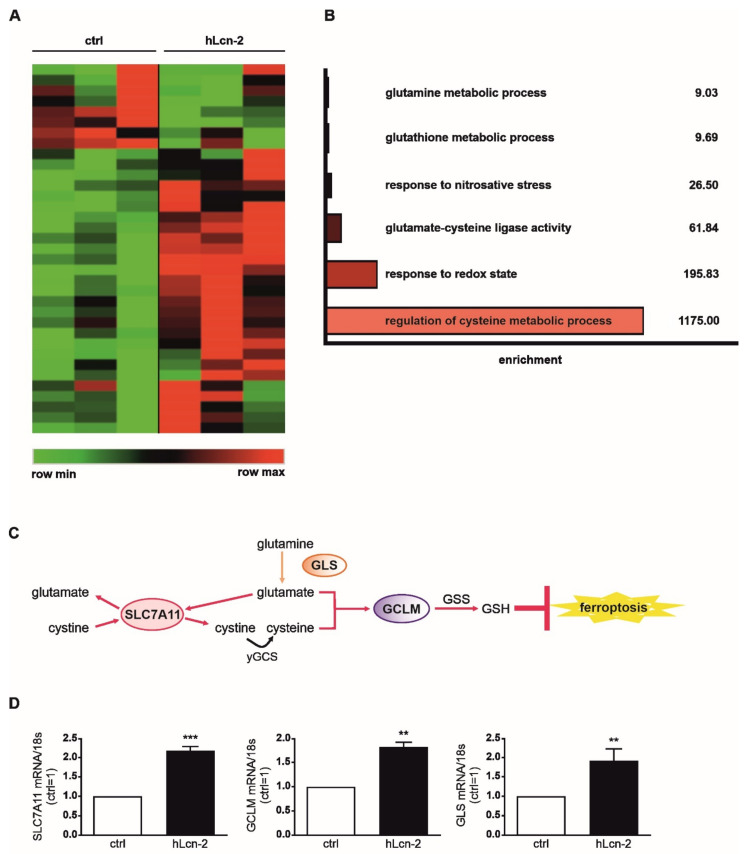
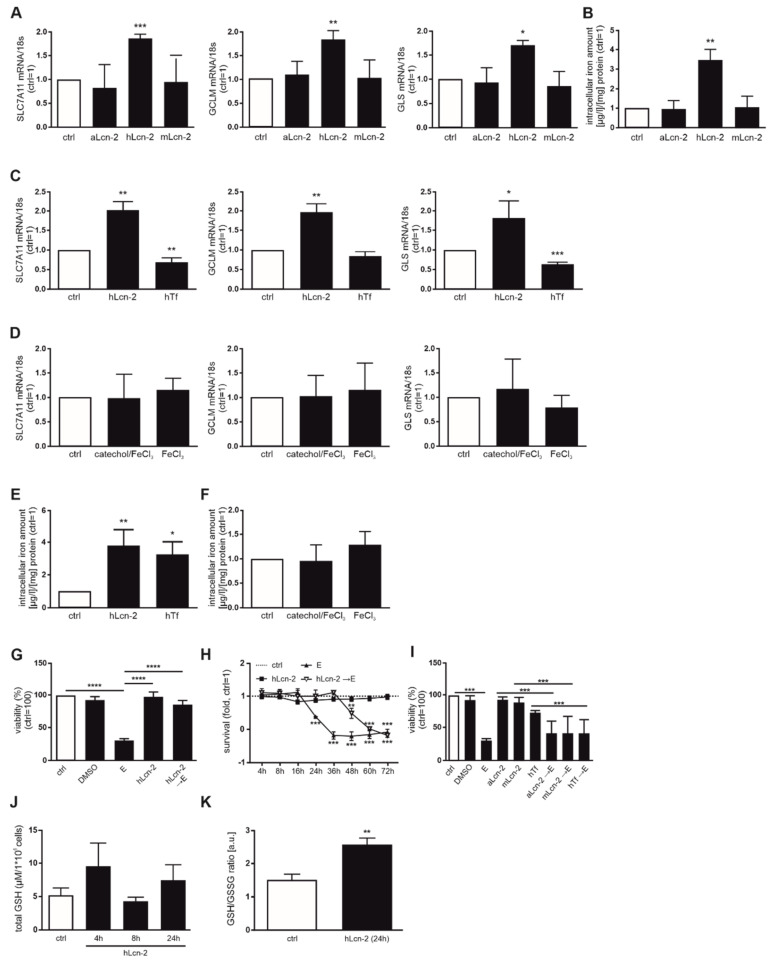
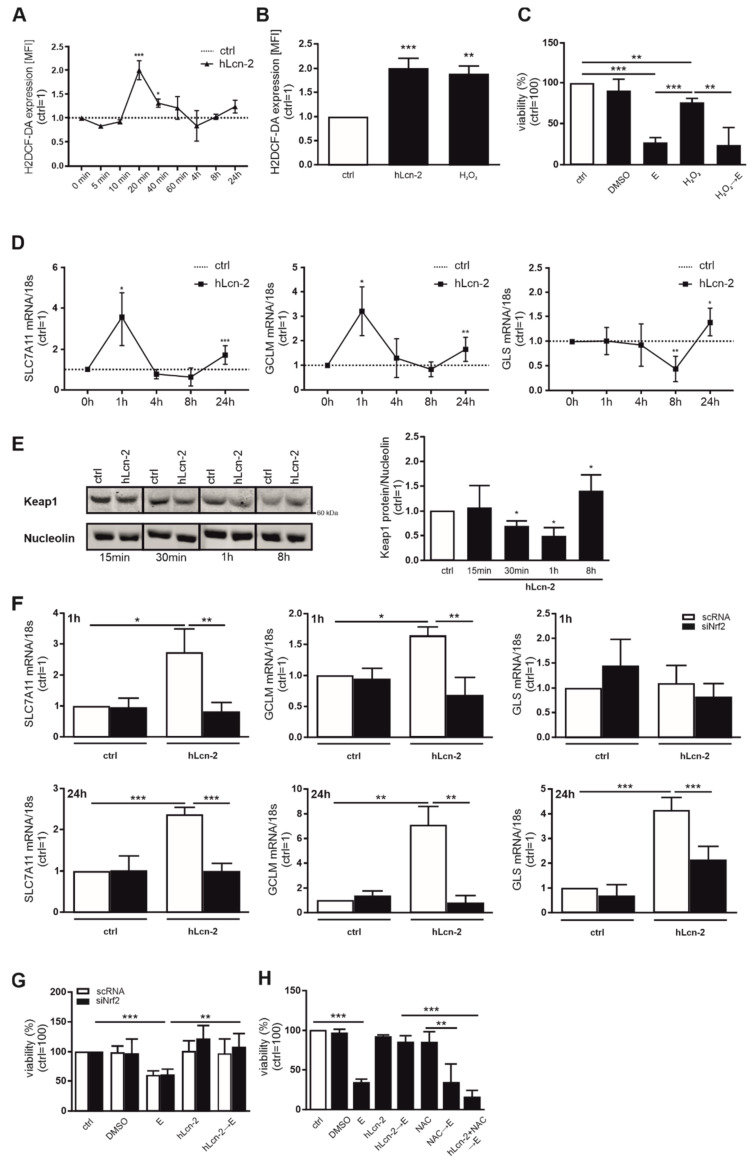
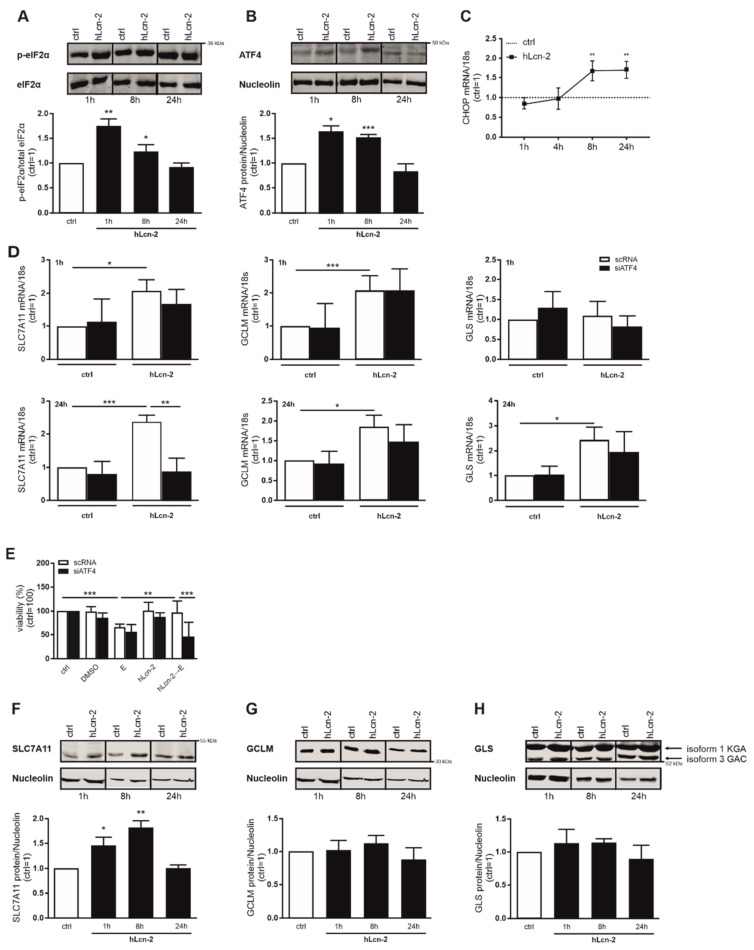
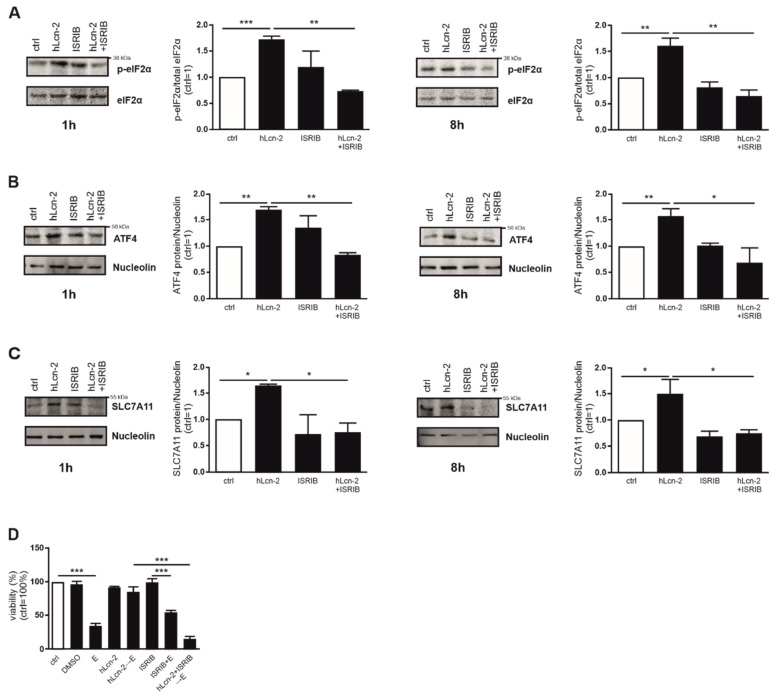
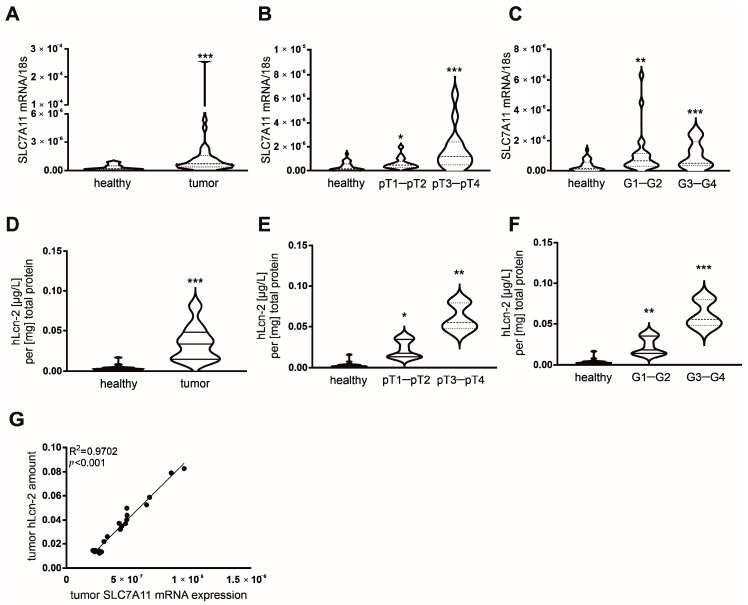
While the importance of the iron-load of lipocalin-2 (Lcn-2) in promoting tumor progression is widely appreciated, underlying molecular mechanisms largely remain elusive. Considering its role as an iron-transporter, we aimed at clarifying iron-loaded, holo-Lcn-2 (hLcn-2)-dependent signaling pathways in affecting renal cancer cell viability. Applying RNA sequencing analysis in renal CAKI1 tumor cells to explore highly upregulated molecular signatures in response to hLcn-2, we identified a cluster of genes (SLC7A11, GCLM, GLS), which are implicated in regulating ferroptosis. Indeed, hLcn-2-stimulated cells are protected from erastin-induced ferroptosis. We also noticed a rapid increase in reactive oxygen species (ROS) with subsequent activation of the antioxidant Nrf2 pathway. However, knocking down Nrf2 by siRNA was not sufficient to induce erastin-dependent ferroptotic cell death in hLcn-2-stimulated tumor cells. In contrast, preventing oxidative stress through N-acetyl-l-cysteine (NAC) supplementation was still able to induce erastin-dependent ferroptotic cell death in hLcn-2-stimulated tumor cells. Besides an oxidative stress response, we noticed activation of the integrated stress response (ISR), shown by enhanced phosphorylation of eIF-2α and induction of ATF4 after hLcn-2 addition. ATF4 knockdown as well as inhibition of the ISR sensitized hLcn-2-treated renal tumor cells to ferroptosis, thus linking the ISR to pro-tumor characteristics of hLcn-2. Our study provides mechanistic details to better understand tumor pro-survival pathways initiated by iron-loaded Lcn-2.

Keywords: ISR; Nrf2; ROS; SLC7A11; erastin; ferroptosis; iron; lipocalin-2; p-eIF2α.


Conflict of interest statement

The authors declare no conflict of interest. The funders had no role in the design of the study; in the collection, analyses, or interpretation of data; in the writing of the manuscript, or in the decision to publish the results.

Figures

Figure 1
Figure 1
RNAseq analysis reveals a hLcn-2-induced cluster of genes involved in the regulation of ferroptosis. If not stated otherwise Lcn-2 treatments were with 5 µg/mL for 24 h in all experiments. (A) Heatmap of differentially expressed genes between iron-loaded, holo-Lcn-2 (hLcn-2) stimulated renal CAKI1 tumor cells and unstimulated control (ctrl) cells (n = 3). (B) GO-term analysis and graph of enriched GO-terms. Enrichment is defined as: (b/n)/(B/N) (N = total number of genes, B = total number of genes associated with a specific GO-term, n = number of genes in the top of the target set, b = number of genes in the intersection). (C) Schematic representation of the glutathione pathway with highlighted target genes SLC7A11, GCLM, and GLS in bold. (D) mRNA expression of SLC7A11, GCLM, and GLS in hLcn-2-stimulated cells in comparison to untreated cells normalized to the housekeeping gene 18S (n = 4). Graphs are displayed as means ± SEM with ** p < 0.01, *** p < 0.001.
Figure 2
Figure 2
hLcn-2 delays erastin-induced ferroptosis. (A) mRNA expression of SLC7A11, GCLM, and GLS after stimulation with iron-free apo-Lcn-2 (aLcn-2), holo-Lcn-2 (hLcn-2), or the no iron-binding mutant Lcn-2 (mLcn-2) (n = 4). (B) Measurement of intracellular iron amount by AAS analysis after Lcn-2 stimulation (n = 4). (C,D) SLC7A11, GCLM, and GLS mRNA expression after (C) holo-Lcn-2 (hLcn-2) compared to holo-Transferrin (hTf) (n = 4), or (D) iron-loaded catechol (catechol/FeCl3) and FeCl3. mRNA expression was normalized to housekeeping gene 18S expression (n = 4). (E,F) AAS measurements of CAKI1 cells stimulated with (E) hLcn-2 compared to hTf (n = 4) or (F) iron-loaded catechol (catechol/FeCl3) compared to FeCl3 alone (n = 4). (G,H) CAKI1 cells were pre-stimulated with hLcn-2 for 24 h, washed and incubated with erastin (10 µM) for additional 24 h. (G) Cell viability measured with CellTiter Blue assay and normalized to the unstimulated control. DMSO served as solvent control (n = 4). (H) Survival assay accomplished with xCELLigence RTCA real-time measurement. A DMSO-stimulated control served for normalization (n = 3). (I) Cell viability measured with CellTiter Blue assay and normalized to the unstimulated control. DMSO served as solvent control. CAKI1 cells were pre-stimulated with either aLcn-2, mLcn-2, or hTf for 24 h, washed and incubated with erastin for additional 24 h (n = 4). (J) Measurement of total GSH by HPLC (n = 4) as well as (K) the ratio of GSH to GSSG by a colorimetric assay in CAKI1 cells after stimulation with hLcn-2 for indicated timepoints (n = 4). Graphs are displayed as means ± SEM with * p < 0.05, ** p < 0.01, *** p < 0.001, **** p < 0.0001.
Figure 3
Figure 3
hLcn-2 fosters Keap1/Nrf2 pathway by inducing ROS. (A,B) CAKI1 cells were stimulated with 5 µg/mL hLcn-2 for the times indicated. H2DCF-DA was applied to measure the appearance of ROS. Results were analyzed as mean fluorescence intensity (MFI) by flow cytometry and are expressed normalized to the untreated control for each time point, showing (A) ROS induction from 5 min to 24 h after hLcn-2 stimulation (n = 4) and (B) similar amounts of ROS following hLcn-2 stimulation or H2O2 addition for 20 min (n = 4). (C) Cell viability measured with CellTiter Blue assay, normalized to unstimulated controls. DMSO served as solvent control. CAKI1 cells were pre-stimulated with H2O2 (500 µM) for 24 h, washed and incubated with erastin (10 µM) for additional 24 h (n = 4). (D) mRNA expression of SLC7A11, GCLM, and GLS after hLcn-2 (5 µg/mL) for the indicated time points. mRNA expression was normalized to housekeeping gene 18S expression (n = 4). (E) Western analysis of Keap1 protein degradation after the stimulation with 5 µg/mL hLcn-2 for the indicated time points. Nucleolin was analyzed as loading control. A representative picture from 4 independent experiments is given along with the densitometrical analysis (n = 4). (F,G) CAKI1 cells were treated with either a siRNA against Nrf2 (siNrf2) or a scrambled control RNA (scRNA) before (F) stimulating the cells with 5 µg/mL hLcn-2 for 1 h (upper panels) or 24 h (lower panels) (n = 4). mRNA expression of SLC7A11, GCLM, and GLS was analyzed relative to the housekeeping gene 18S expression and results are represented normalized to scRNA-treated control cells (n = 4). (G) Cell viability measured with CellTiter Blue assay, normalized against the unstimulated control. DMSO served as solvent control. scRNA- or siNrf2-CAKI1 cells were pre-stimulated with 5 µg/mL hLcn-2 for 24 h, washed, and incubated with erastin (10 µM) for additional 24 h (n = 4). (H) Cell viability assay normalized to the unstimulated control. DMSO served as solvent control. CAKI1 cells were co-stimulated with 5 µg/mL hLcn-2 and N-acetyl-l-cysteine (NAC; 10 mM) for 24 h, washed, and incubated with erastin (10 µM) for additional 24 h (n = 4). Graphs are displayed as means ± SEM with * p < 0.05, ** p < 0.01, *** p < 0.001.
Figure 4
Figure 4
hLcn-2 induces the phosphorylation of eIF2α with subsequent activation of ATF4 and SLC7A11. (A,B) Western analysis of (A) p-eIF2α (n = 3) and (B) ATF4 protein expression after the stimulation with 5 µg/mL hLcn-2 for the indicated time points. Either total eIF2α or nucleolin was analyzed as a loading control. A representative picture (upper panel) from 4 independent experiments is given along with the densitometrical analysis (lower panel) (n = 3). (C) mRNA expression of CHOP after hLcn-2 (5 µg/mL) for the indicated time points. mRNA expression was normalized to housekeeping gene 18S expression (n = 4). (D,E) CAKI1 cells were treated with either a siRNA to knockdown ATF4 (siATF4) or a scrambled control RNA (scRNA) before stimulation with 5 µg/mL hLcn-2 for (D) 1 h (upper panel) or 24 h (lower panel). mRNA expression of SLC7A11, GCLM, and GLS was analyzed relative to the housekeeping gene 18S expression and results are represented normalized to scRNA-treated control cells (n = 4). (E) Cell viability measured with CellTiter Blue assay, normalized to unstimulated controls. DMSO served as solvent control. scRNA- or siATF4-CAKI1 cells were pre-stimulated with 5 µg/mL hLcn-2 for 24 h, washed, and incubated with erastin (10 µM) for additional 24 h (n = 4). (FH) Western analysis of (F) SLC7A11 (n = 3), (G) GCLM (n = 3), and (H) GLS protein expression after the stimulation with 5 µg/mL hLcn-2 for the indicated time points. Nucleolin was analyzed as loading control. A representative picture (upper panels) from 4 independent experiments is given along with the densitometrical analysis (lower panels) (n = 3). Graphs are displayed as means ± SEM with * p < 0.05, ** p < 0.01, *** p < 0.001.
Figure 5
Figure 5
hLcn-2 delays ferroptosis through induction of the integrated stress response. (AC) Western analysis of (A) p-eIF2α (n = 3), (B) ATF4 (n = 3), and (C) SLC7A11 protein expression after the co-stimulation of hLcn-2 (5 µg/mL) and the inhibitor of the integrated stress response (ISRIB; 1 µM) for the indicated time points. Either total eIF2α or nucleolin was analyzed as loading control. A representative picture (left panels) from 4 independent experiments is given along with the densitometrical analysis (right panels) (n = 3). (D) Cell viability measured with CellTiter Blue assay, normalized against the unstimulated control. DMSO served as solvent control. Erastin (10 µM) was used to induce ferroptosis for 24 h. CAKI1 cells were co-stimulated with 5 µg/mL hLcn-2 and 1 µM ISRIB for 24 h, washed, and incubated with erastin (10 µM) for additional 24 h (n = 4). Graphs are displayed as means ± SEM with * p < 0.05, ** p < 0.01, *** p < 0.001.
Figure 6
Figure 6
SLC7A11 mRNA expression correlates with the amount of iron-loaded Lcn-2 in tumor tissue of ccRCC patients. (A) mRNA expression of SLC7A11 in samples of tumor tissue of ccRCC patients (n = 32) compared to samples of adjacent healthy tissue of the same patients. (B,C) SLC7A11 mRNA expression in healthy tissue, (B) G1–G2 (n = 23) and G3–G4 (n = 9) tumor grade and (C) pT1–pT2 (n = 18) and pT3–pT4 (n = 14) tumor stage. mRNA expression was normalized to housekeeping gene 18S expression. (D) The amount of hLcn-2 was analyzed by AAS measurements in Lcn-2-immunoprecipitated samples of tumor tissue of ccRCC patients (n = 25) and compared to samples of adjacent healthy tissue of the same patients. (E,F) Lcn-2-bound iron in healthy tissue, (E) G1–G2 and G3–G4 tumor grade, and (F) pT1–pT2 and pT3–pT4 tumor stage (n = 25). (G) Correlation analysis between SLC7A11 mRNA expression and the amount of AAS-detected hLcn-2 in tumor tissue of ccRCC patients (n = 25). Significance of the correlation was determined by Spearman’s test including all investigated groups. Graphs are displayed as (AF) violin plots, indicating the median and quartiles with whiskers reaching up to 1.5 times the interquartile range and (G) simple linear regression of correlations, with * p < 0.05, ** p < 0.01, *** p < 0.001.

Similar articles

Cited by

References

    1. Linehan W.M. Genetic basis of kidney cancer: Role of genomics for the development of disease-based therapeutics. Genome Res. 2012;22:2089–2100. doi: 10.1101/gr.131110.111. - DOI - PMC - PubMed
    1. Linehan J.A., Nguyen M.M. Kidney cancer: The new landscape. Curr. Opin. Urol. 2009;19:133–137. doi: 10.1097/MOU.0b013e328323f5ab. - DOI - PubMed
    1. Cairns R.A., Harris I.S., Mak T.W. Regulation of cancer cell metabolism. Nat. Rev. Cancer. 2011;11:85–95. doi: 10.1038/nrc2981. - DOI - PubMed
    1. Yang W.S. Stockwell BR. Ferroptosis: Death by Lipid Peroxidation. Trends Cell Biol. 2016;26:165–176. doi: 10.1016/j.tcb.2015.10.014. - DOI - PMC - PubMed
    1. Yang W.S., SriRamaratnam R., Welsch M.E., Shimada K., Skouta R., Viswanathan V.S., Cheah J.H., Clemons P.A., Shamji A.F., Clish C.B., et al. Regulation of ferroptotic cancer cell death by GPX4. Cell. 2014;156:317–331. doi: 10.1016/j.cell.2013.12.010. - DOI - PMC - PubMed