. 2021 May 18;11(5):322.
doi: 10.3390/metabo11050322.

Mitochondrial Fission Governed by Drp1 Regulates Exogenous Fatty Acid Usage and Storage in Hela Cells

Affiliations

Mitochondrial Fission Governed by Drp1 Regulates Exogenous Fatty Acid Usage and Storage in Hela Cells

Jae-Eun Song et al. Metabolites. .

Abstract

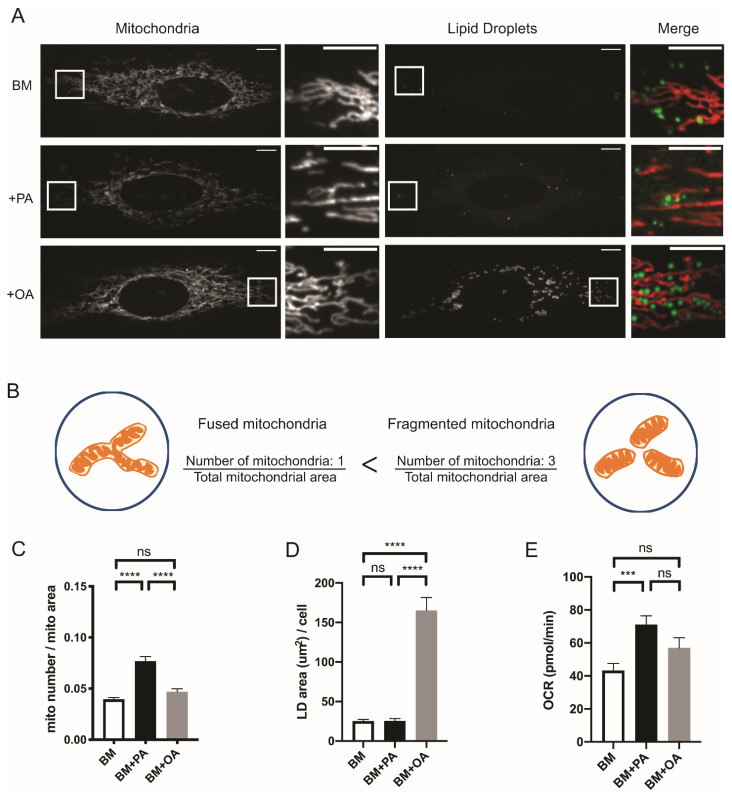
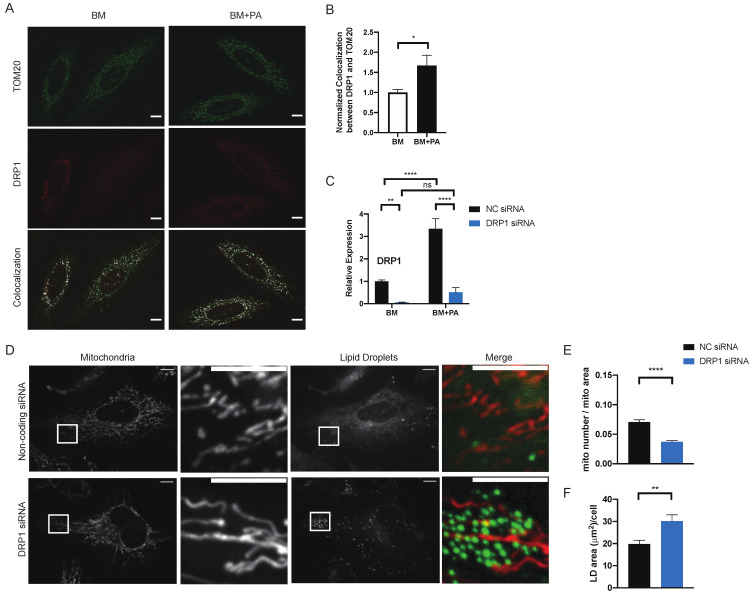
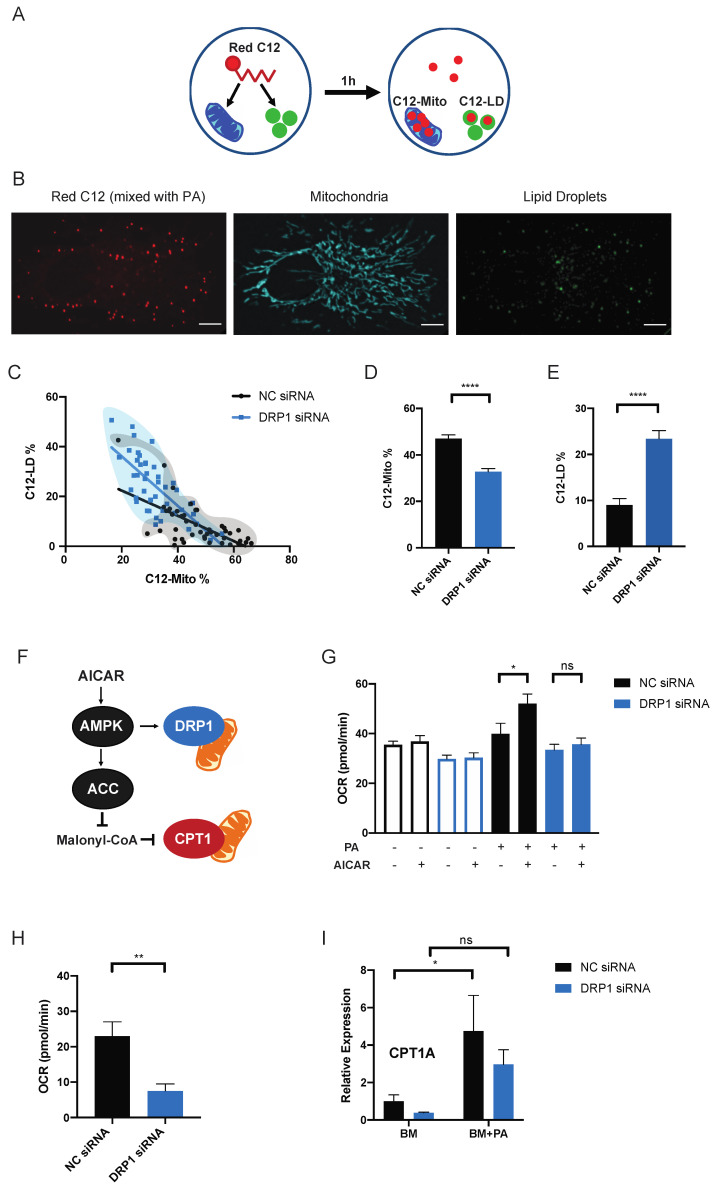
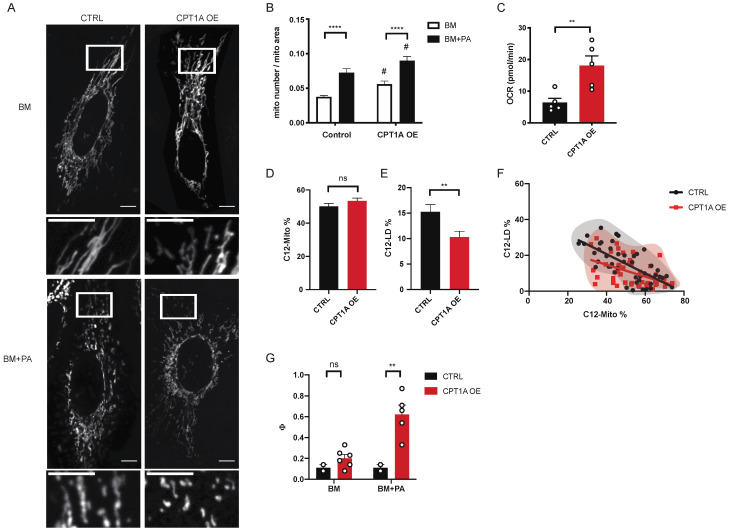
In the presence of high abundance of exogenous fatty acids, cells either store fatty acids in lipid droplets or oxidize them in mitochondria. In this study, we aimed to explore a novel and direct role of mitochondrial fission in lipid homeostasis in HeLa cells. We observed the association between mitochondrial morphology and lipid droplet accumulation in response to high exogenous fatty acids. We inhibited mitochondrial fission by silencing dynamin-related protein 1(DRP1) and observed the shift in fatty acid storage-usage balance. Inhibition of mitochondrial fission resulted in an increase in fatty acid content of lipid droplets and a decrease in mitochondrial fatty acid oxidation. Next, we overexpressed carnitine palmitoyltransferase-1 (CPT1), a key mitochondrial protein in fatty acid oxidation, to further examine the relationship between mitochondrial fatty acid usage and mitochondrial morphology. Mitochondrial fission plays a role in distributing exogenous fatty acids. CPT1A controlled the respiratory rate of mitochondrial fatty acid oxidation but did not cause a shift in the distribution of fatty acids between mitochondria and lipid droplets. Our data reveals a novel function for mitochondrial fission in balancing exogenous fatty acids between usage and storage, assigning a role for mitochondrial dynamics in control of intracellular fuel utilization and partitioning.

Keywords: fatty acid oxidation; lipid homeostasis; mitochondrial dynamics.


Conflict of interest statement

The authors declare no conflict of interest.

Figures

Figure 1
Figure 1
Mitochondrial morphology is associated with the exogenous fatty acid usage and storage. (A) Representative images of live HeLa cells incubated in 5 mM glucose + 5 mM glutamine (BM); 5 mM glucose + 5 mM glutamine + 100 μM palmitic acid (BM + PA); 5 mM glucose + 5 mM glutamine + 100 μM oleic acid (BM + OA) for 4 h. Mitochondria are labeled with MitoTracker Orange and lipid droplets are labeled with LipidTOX Green. Scale bars = 10 μm. (B) Cartoon of mitochondria in a cell demonstrating how mitochondrial morphology was calculated. The total number of mitochondria was divided by the total area of mitochondria per cell to quantify the fragmentation of mitochondria. (C) Quantification of mitochondrial morphology. BM (n = 47); BM + PA (n = 45); BM + OA (n = 44). 3 independent experiments; Data are expressed as mean ± S.E.M. Ordinary one-way ANOVA-Tukey’s multiple comparisons test. (D) Quantification of Lipid Droplets contents. BM (n = 43); BM + PA (n = 41); BM + OA (n = 46). 3 independent experiments. Data are expressed as mean ± S.E.M. Ordinary one-way ANOVA-Tukey’s multiple comparisons test. (E) Mitochondrial oxygen consumption rate (OCR) associated with ATP respiration. BM (n = 27); BM + PA (n = 25); BM + OA (n = 24). 3 independent experiments. Data are expressed as mean ± S.E.M. Ordinary one-way ANOVA-Tukey’s multiple comparisons test. ns = not significant; *** p < 0.001; **** p < 0.0001. All pictures were taken with spinning-disc confocal microscopy.
Figure 2
Figure 2
PA-induced mitochondrial fission is regulated by DRP1. (A) Representative images of HeLa cells incubated in BM or BM + PA for 1-h prior and then fixed and labelled with TOM20 and DRP1 antibodies. Colocalization of TOM20 and DRP1 was identified by colocalization plugin (ImageJ). Scale bars = 10 μM. (B) Quantification of (A). The values were normalized to BM. n = 13 z-stack images. ~40 cells. 3 independent experiments. Data are expressed as mean ± S.E.M. Unpaired two-tailed t-test. * p < 0.05 (C) Normalized expression level of DRP1 using RT-qPCR. n = 5. Data are expressed as mean ± S.E.M. 2 way ANOVA-Sidak’s multiple comparison test. ** p < 0.01 **** p < 0.0001. (D) Representative images of live HeLa cells after transfections with non-coding siRNA (NC siRNA) and DRP1 siRNA after 4-h incubation with BM + PA. Mitochondria are labelled with MitoTracker DeepRed and lipid droplets are labelled with LipidTOX Green. Scale bars = 10 μm. Quantification of mitochondrial morphology (E) and lipid droplets (F) of cells shown in (A). NC siRNA (n = 42); DRP1 siRNA (n = 44). 3 independent experiments. Data are expressed as mean ± S.D. Unpaired two-tailed t-test. **** p < 0.0001; ** p < 0.01.
Figure 3
Figure 3
DRP1 directs the distribution of exogenous fatty acid between mitochondria and lipid droplets. (A) After 1-h incubation with Red C12, the total Red C12 fluorescence intensity per cell and the C12 fluorescence intensity coming from mitochondrial ROI (C12-Mito) and lipid droplets ROI (C12-LD) were measured. C12-Mito or C12-LD was divided by the corresponding total C12 to calculate the percentages of C12 fluorescence intensity coming from mitochondria and C12 fluorescence intensity coming from lipid droplets per cell. (B) Representative images of live HeLa cells incubated with Red C12 (100 mM C12 was mixed with 100 mM PA in 1:2000 ratio) and labeled with MitoTracker DeepRed and LipidTOX Green. Scale bars = 10 μm. (C) The xy-plot of C12-Mito% and C12-LD% of cells transfected with NC siRNA or DRP1 siRNA to visualize the distribution of fatty acids between mitochondria and lipid droplets within an individual cell. The measurements of individual cells are plotted. The populations of control cells (black) and DRP1 KD cells (blue) are marked with translucent bubbles to visualize the populational shift. Simple linear regression values: NC siRNA: slope = −0.5797, R2 = 0.4264; DRP1 siRNA: slope = −0.9942, R2 = 0.5573. Percentage of C12 signal coming from mitochondria (D) and from lipid droplets (E) calculated within individual cells. n = 45. 3 independent experiments. Data are expressed as mean ± S.E.M. Unpaired two-tailed t-test. **** p < 0.0001. (F) AMPK pathway connecting MFF-DRP1 mitochondrial fission and ACC-CPT1 fatty acid oxidation. (G) The effect of AICAR on mitochondrial ATP-linked OCR. Cells were incubated with or without 500 µM AICAR for 2 h then in BM or BM + PA for 1 h in Seahorse media. -: absence; +: presence. n = 12–15. Data are expressed as mean ± S.E.M. Unpaired two-tailed t-test * p < 0.05. (H) Measurement of fatty acid oxidation in response to PA using etomoxir. NC siRNA (n = 7) DRP1 siRNA (n = 9). Data are expressed as mean ± S.E.M. Unpaired two-tailed t-test ** p < 0.01. (I) Normalized expression levels of CPT1A using RT-qPCR. n = 5. Data are expressed as mean ± S.E.M. 2 way ANOVA-Sidak’s multiple comparison test. * p < 0.05.
Figure 4
Figure 4
CPT1A regulates the mitochondrial capacity of fatty acid processing. (A) Representative images of live WT HeLa cells (CTRL) and CPT1A overexpression HeLa cells (CPT1A OE) incubated in BM or BM + PA. Scale bars = 10 μm. (B) The quantification of mitochondrial morphology. CTRL: BM (n = 33), BM + PA (n = 29); CPT1A OE: BM (n = 33), BM + PA (n = 31). 3 independent experiments. Data are expressed as mean ± S.E.M. 2 way ANOVA-Sidak’s multiple comparison test. **** p < 0.0001 (BM vs BM + PA); # p < 0.05 (CTRL vs CPT1A OE). (C) Fatty acid oxidation-linked OCR response to PA using etomoxir. Data are expressed as mean ± S.E.M. Unpaired two-tailed t-test. ** p < 0.01. (D) The percentage of Red C12 fluorescence intensity coming from mitochondria (C12-Mito%) and (E) The percentage of Red C12 fluorescence intensity coming from lipid droplets (C12-LD%). n = 46. 3 independent experiments. Data are expressed as mean ± S.E.M. Unpaired two-tailed t-test. ** p < 0.01. (F) The xy-plot of C12-Mito% and C12-LD% to visualize the distribution of fatty acids between mitochondria and lipid droplets within an individual cell. The measurements of individual cells are plotted. The populations of control cells (black) and CPT1A OE cells (red) are marked with translucent bubbles to visualize the populational shift. Simple linear regression values: CTRL: slope = −0.5386, R2 = 0.4784. CPT1A OE: slope = −0.3328, R2 = 0.2251. (G) Measurement of cataplerotic reactions (Φ: the ratio of malate to pyruvate positional enrichment) of the TCA cycle using 13C MIMOSA precursor-product isotopomer analysis. Data are expressed as mean ± S.E.M. 2 way ANOVA-Sidak’s multiple comparison test. ** p < 0.01.

References

    1. Ishihara N., Jofuku A., Eura Y., Mihara K. Regulation of mitochondrial morphology by membrane potential, and DRP1-dependent division and FZO1-dependent fusion reaction in mammalian cells. Biochem. Biophys. Res. Commun. 2003;301:891–898. doi: 10.1016/S0006-291X(03)00050-0. - DOI - PubMed
    1. Buck M.D., Sullivan D.O., Geltink R.I.K., Curtis J.D., Chang C.-H., Sanin D.E., Qiu J., Kretz O., Braas D., Chen Q., et al. Mitochondrial Dynamics Controls T Cell Fate through Article Mitochondrial Dynamics Controls T Cell Fate through Metabolic Programming. Cell. 2016;166:1–14. doi: 10.1016/j.cell.2016.05.035. - DOI - PMC - PubMed
    1. Martínez-Diez M., Santamaría G., Ortega A.D., Cuezva J.M. Biogenesis and Dynamics of Mitochondria during the Cell Cycle: Significance of 3′UTRs. PLoS ONE. 2006;1:e107. doi: 10.1371/journal.pone.0000107. - DOI - PMC - PubMed
    1. Youle R.J., van der Bliek A.M. Mitochondrial fission, fusion, and stress. Science. 2012;337:1062–1065. doi: 10.1126/science.1219855. - DOI - PMC - PubMed
    1. Molina A.J., Wikstrom J.D., Stiles L., Las G., Mohamed H., Elorza A., Walzer G., Twig G., Katz S., Corkey B.E., et al. Mitochondrial Networking Protects-Cells From Nutrient-Induced Apoptosis. Diabetes. 2009;58:2303–2315. doi: 10.2337/db07-1781. - DOI - PMC - PubMed