

Relationship between Air Pollutant Exposure and Gynecologic Cancer Risk
- PMID: 34069801
- PMCID: PMC8157305
- DOI: 10.3390/ijerph18105353
Relationship between Air Pollutant Exposure and Gynecologic Cancer Risk
Abstract
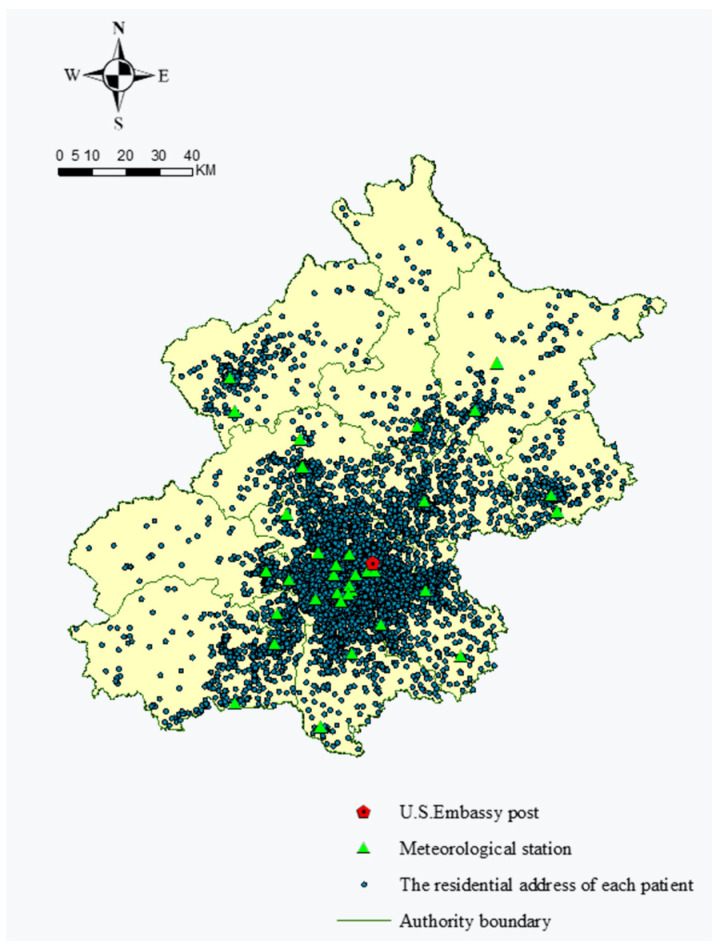
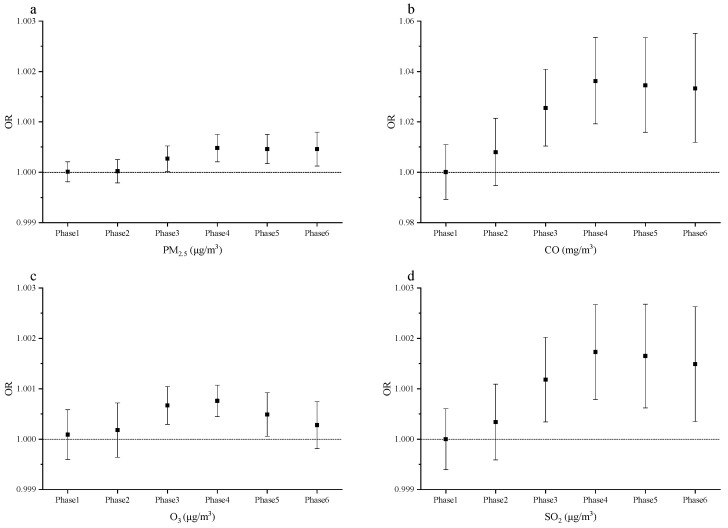
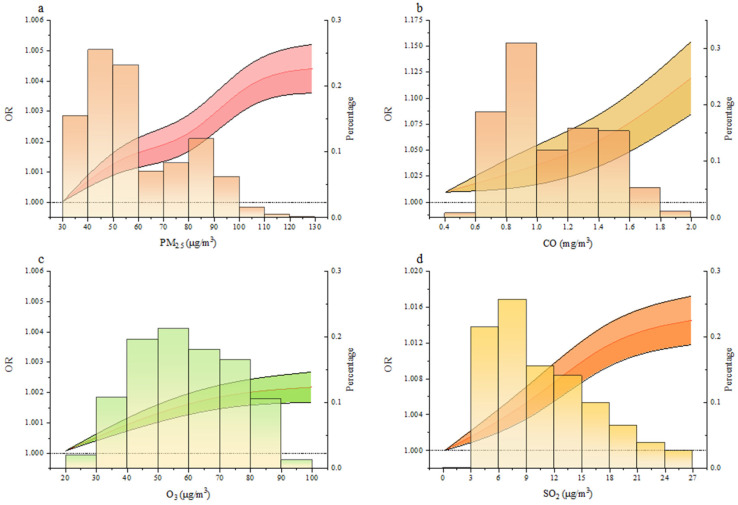
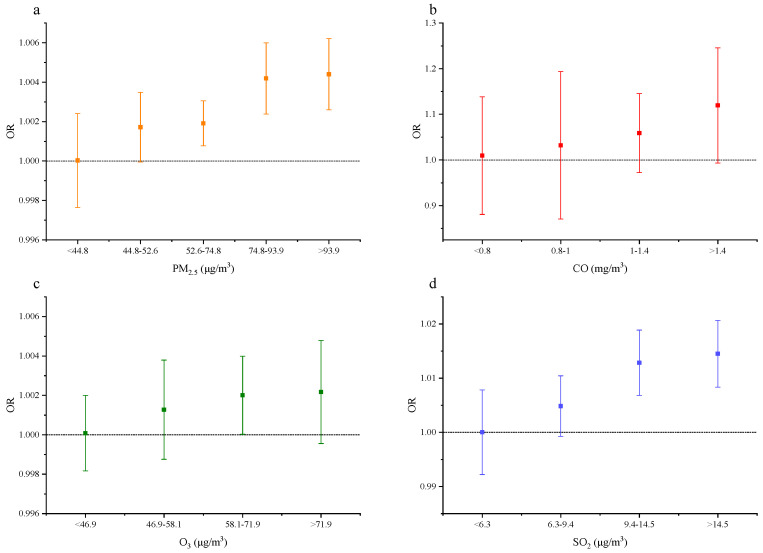
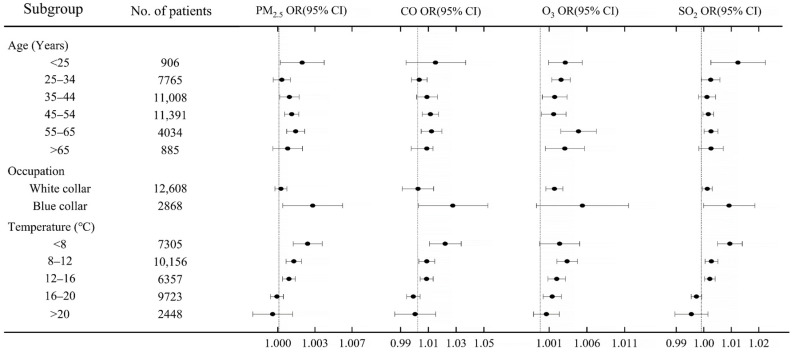
Exposure to air pollution has been suggested to be associated with an increased risk of women's health disorders. However, it remains unknown to what extent changes in ambient air pollution affect gynecological cancer. In our case-control study, the logistic regression model was combined with the restricted cubic spline to examine the association of short-term exposure to air pollution with gynecological cancer events using the clinical data of 35,989 women in Beijing from December 2008 to December 2017. We assessed the women's exposure to air pollutants using the monitor located nearest to each woman's residence and working places, adjusting for age, occupation, ambient temperature, and ambient humidity. The adjusted odds ratios (ORs) were examined to evaluate gynecologic cancer risk in six time windows (Phase 1-Phase 6) of women's exposure to air pollutants (PM2.5, CO, O3, and SO2) and the highest ORs were found in Phase 4 (240 days). Then, the higher adjusted ORs were found associated with the increased concentrations of each pollutant (PM2.5, CO, O3, and SO2) in Phase 4. For instance, the adjusted OR of gynecological cancer risk for a 1.0-mg m-3 increase in CO exposures was 1.010 (95% CI: 0.881-1.139) below 0.8 mg m-3, 1.032 (95% CI: 0.871-1.194) at 0.8-1.0 mg m-3, 1.059 (95% CI: 0.973-1.145) at 1.0-1.4 mg m-3, and 1.120 (95% CI: 0.993-1.246) above 1.4 mg m-3. The ORs calculated in different air pollution levels accessed us to identify the nonlinear association between women's exposure to air pollutants (PM2.5, CO, O3, and SO2) and the gynecological cancer risk. This study supports that the gynecologic risks associated with air pollution should be considered in improved public health preventive measures and policymaking to minimize the dangerous effects of air pollution.
Keywords: air pollutant exposure; association; gynecologic cancer risk.
Conflict of interest statement
The authors declare no conflict of interest. The funders had no role in the design of the study; in the collection, analyses, or interpretation of data; in the writing of the manuscript, or in the decision to publish the results.
Figures
References
-
- Zhang L., Liu W., Hou K., Lin J., Zhou C., Tong X., Wang Z., Wang Y., Jiang Y., Wang Z., et al. Air Pollution-Induced Missed Abortion Risk for Pregnancies. Nat. Sustain. 2019;2:1011–1017. doi: 10.1038/s41893-019-0387-y. - DOI
Publication types
MeSH terms
Substances
LinkOut - more resources
Full Text Sources
Medical
