. 2021 May 18;22(10):5291.
doi: 10.3390/ijms22105291.

Genome-Wide Analysis of nsLTP Gene Family and Identification of SiLTPs Contributing to High Oil Accumulation in Sesame (Sesamum indicum L.)

Affiliations

Genome-Wide Analysis of nsLTP Gene Family and Identification of SiLTPs Contributing to High Oil Accumulation in Sesame (Sesamum indicum L.)

Shengnan Song et al. Int J Mol Sci. .

Abstract

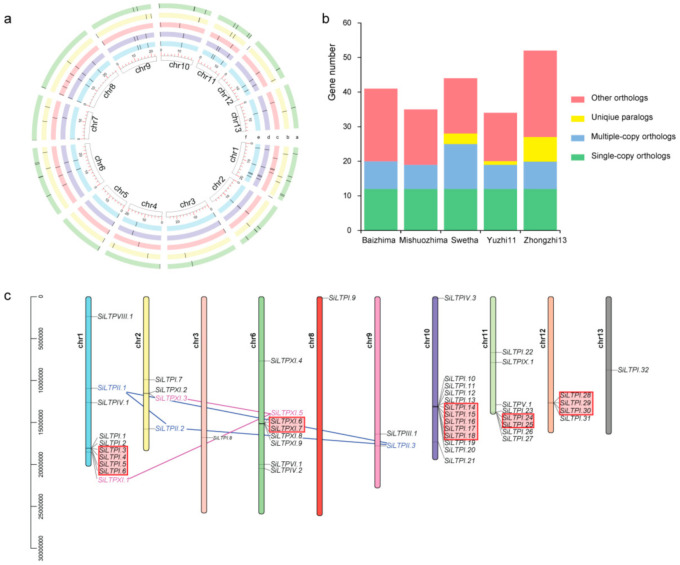
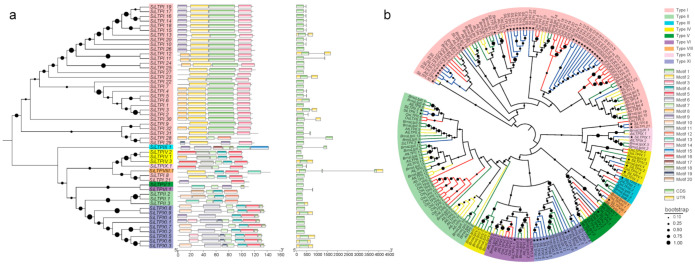
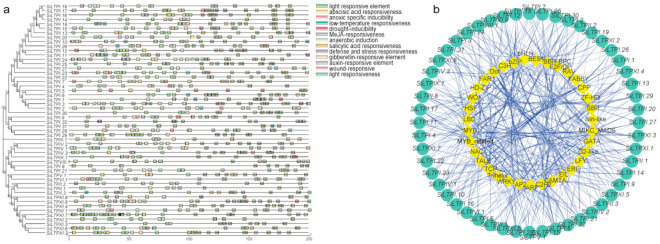
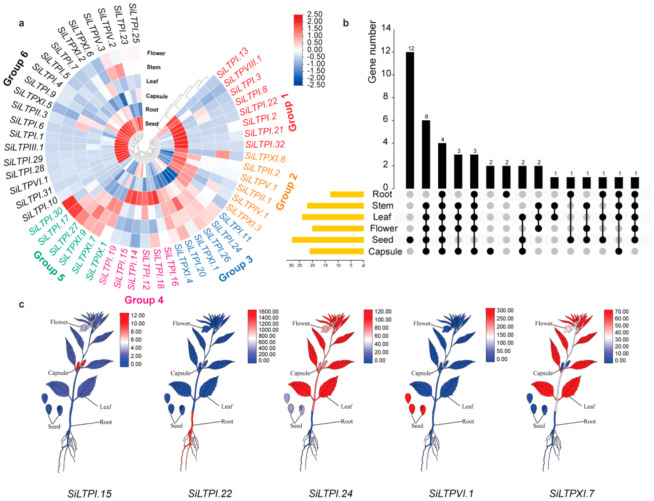
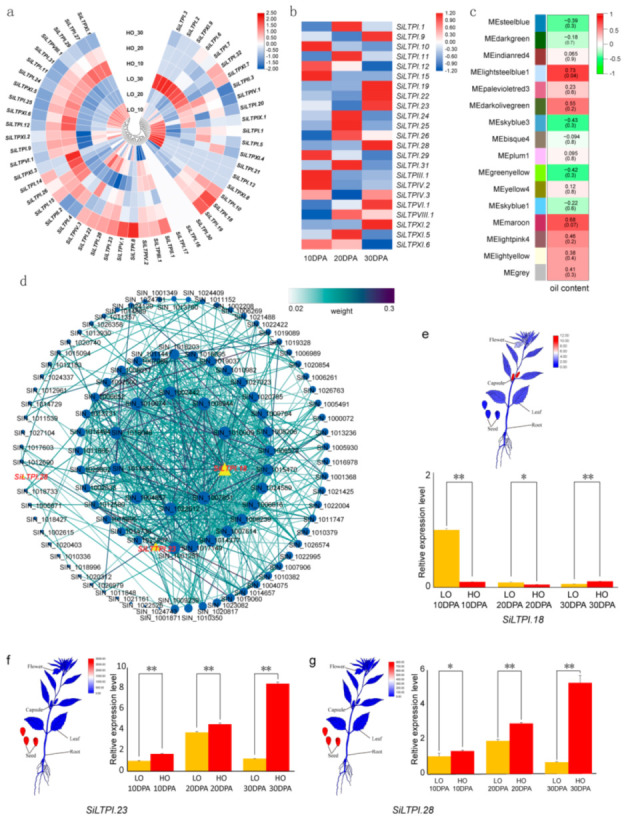
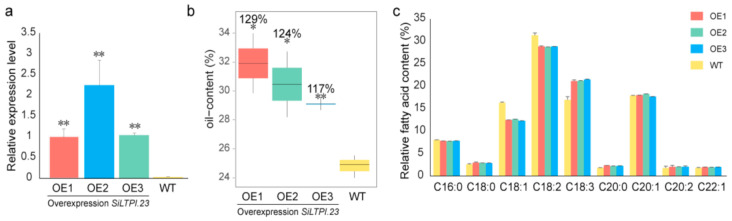
The biosynthesis and storage of lipids in oil crop seeds involve many gene families, such as nonspecific lipid-transfer proteins (nsLTPs). nsLTPs are cysteine-rich small basic proteins essential for plant development and survival. However, in sesame, information related to nsLTPs was limited. Thus, the objectives of this study were to identify the Sesamum indicum nsLTPs (SiLTPs) and reveal their potential role in oil accumulation in sesame seeds. Genome-wide analysis revealed 52 SiLTPs, nonrandomly distributed on 10 chromosomes in the sesame variety Zhongzhi 13. Following recent classification methods, the SiLTPs were divided into nine types, among which types I and XI were the dominants. We found that the SiLTPs could interact with several transcription factors, including APETALA2 (AP2), DNA binding with one finger (Dof), etc. Transcriptome analysis showed a tissue-specific expression of some SiLTP genes. By integrating the SiLTPs expression profiles and the weighted gene co-expression network analysis (WGCNA) results of two contrasting oil content sesame varieties, we identified SiLTPI.23 and SiLTPI.28 as the candidate genes for high oil content in sesame seeds. The presumed functions of the candidate gene were validated through overexpression of SiLTPI.23 in Arabidopsis thaliana. These findings expand our knowledge on nsLTPs in sesame and provide resources for functional studies and genetic improvement of oil content in sesame seeds.

Keywords: Sesamum indicum; candidate genes; lipid transfer proteins; oil content; overexpression; transcriptomic analysis.


Conflict of interest statement

The authors declare no conflict of interest.

Figures

Figure 1
Figure 1
Chromosome location, ortholog and duplication analysis of sesame varieties. (a) From the outer edge inward, each circle represents Zhongzhi13, Swetha, yuzhi11, Baizhima, Mishuozhima and the 13 chromosomes. The black lines in each circle represent nsLTP genes. The red scale bar in the innermost circle represents 20 Mb nucleotides. The chromosome number is next to each chromosome. (b) Ortholog analysis of five sesame varieties. The different color of the histogram represents different types of orthologs. (c) Chromosome location and duplication analysis of 52 SiLTPs in sesame variety Zhongzhi13. The location of each SiLTP is indicated by a black horizontal line. The tandem duplications were represented by red boxes. The segmental duplications were represented by blue and rose red lines. The blue and rose red represent a set of segmental duplication events, respectively.
Figure 2
Figure 2
Phylogenetic relationships, gene structure and motif compositions of SiLTPs. (a) Left: phylogenetic tree of 52 SiLTPs. Different color of arcs represents different types of SiLTPs. Black dot represents the clades support values in the phylogenetic trees. Middle: conserved motif composition of SiLTPs. Different colors of boxes represent different motifs. Gray lines represent the nonconserved sequences. Scale bar at the bottom represents 20aa. Right: intron–exon structure of SiLTPs. Green boxes represent exon, gray lines represent introns, and yellow boxes represent UTR. Scale bar at the bottom represents 500 bp. (b) Phylogenetic tree of A. thaliana, B. rapa, O. sativa and 52 SiLTPs amino acid sequences. Different color of arcs represents different types of nsLTPs. Different color of clades represents different varieties. Stars represent the genes of the sesame variety Zhongzhi13. Black dot represents the clades support values in the phylogenetic trees.
Figure 3
Figure 3
Prediction of analysis of cis-acting elements and prediction of transcription factors among the SiLTPs. (a) The cis-acting elements detected in the promoter region of each SiLTP. (b) Regulation networks between SiLTP and potential transcription factors. Gene IDs in the green circle refer to SiLTPs, and the genes in the yellow diamond represent the combining transcription factors. Relationships between SiLTPs and transcription factors were represented by blue lines.
Figure 4
Figure 4
Expression patterns of SiLTP genes in different tissues in sesame. (a) Heatmap representation and hierarchical clustering of SiLTPs in different tissues. Different color of SiLTP gene IDs represents different expression patterns. Color scale represents the relative signal intensity of log10-transformed RPKM values. (b) Number of SiLTP genes that were expressed in each tissue. Yellow bar on the left indicates the whole expressed gene number in each tissue. Black dot means the expressed genes in this tissue and the black bar in the top mean the number expressed in different tissue group. (c) Randomly selected 5 SiLTPs to show the expression pattern. Color scale represents the relative signal intensity of RPKM values.
Figure 5
Figure 5
Expression patterns of SiLTP genes in high and low oil content sesame. (a) Heatmap representation and hierarchical clustering of SiLTPs in high and low oil content sesame seeds. The color scale represents the relative signal intensity of log10-transformed RPKM values. HO: high oil content sesame ZZM4728; LO: low oil content sesame ZZM3495. (b) The upregulated SiLTPs in at least one period of HO sesame. Heatmap representation of the log10-transformed ratio of SiLTPs expression in high and low oil content sesame seeds. (c) Heatmap of the correlation of WGCNA modules with oil content. (d) Cystoscope representation of co-expressed genes in the lightsteelblue1 module, which with the highest correlation with oil content (cor = 0.73). Gene IDs in yellow triangles refer to SiLTP genes, and the genes in the blue dot represent other sesame genes. The weight values between genes were represented by lines in different colors. (e) Expression levels of SiLTPI.18. Top: tissue expression levels of SiLTPI.18. Bottom: relative expression levels of SiLTPI.18 were analyzed by qRT–PCR, using sesame histone H3.3 gene as the internal control. Error bars represent the standard deviations of three replicates. Asterisks indicate significant expression difference between HO and LO sesame seeds (n = 3, *, 0.01 < p < 0.05; **, p < 0.01). (f) Expression levels of SiLTPI.23. Left: tissue expression of SiLTPI.23. Right: relative expression levels of SiLTPI.23 analyzed by qRT–PCR. (g) The t expression levels of SiLTPI.28. Left: tissue expression of SiLTPI.28. Right: relative expression levels of SiLTPI.28 analyzed by qRT–PCR.
Figure 6
Figure 6
Result of SiLTPI.23 overexpressed in Arabidopsis. (a) Relative expression levels of SiLTPI.23 in Arabidopsis T2 WT and SiLTPI.23 OE lines, analyzed by qRT–PCR. Error bars represent the standard deviations of three replicates. Asterisks indicate a significant difference from the WT (n = 3, **, p < 0.01). (b) Seed oil content of the Arabidopsis T2 WT and SiLTPI.23 OE lines. Error bars represent the standard deviations of three replicates. The value on the column represents the percentage of FA content in WT seeds. Asterisks indicate a significant difference from WT (n = 3, *, 0.01 < p < 0.05; **, p < 0.01). (c) Relative fatty acid content of the Arabidopsis T2 WT and SiLTPI.23 OE lines. Error bars represent the standard deviations of three replicates.

Similar articles

Cited by

References

    1. Johnson L.A., Suleiman T.M., Lusas E.W. Sesame protein: A review and prospectus. J. Am. Oil Chem. Soc. 1979;56:463–468. doi: 10.1007/BF02671542. - DOI - PubMed
    1. Wang L.H., Yu S., Tong C.B., Zhao Y.Z., Liu Y., Song C., Zhang Y.X., Zhang X.D., Wang Y., Hua W., et al. Genome sequencing of the high oil crop sesame provides insight into oil biosynthesis. Genome Biol. 2014;15:R39. doi: 10.1186/gb-2014-15-2-r39. - DOI - PMC - PubMed
    1. Wei X., Liu K., Zhang Y., Feng Q., Wang L., Zhao Y., Li D., Zhao Q., Zhu X., Zhu X., et al. Genetic discovery for oil production and quality in sesame. Nat. Commun. 2015;6:8609. doi: 10.1038/ncomms9609. - DOI - PMC - PubMed
    1. Wang L., Zhang Y., Li D., Dossa K., Wang M.L., Zhou R., Yu J., Zhang X. Gene expression profiles that shape high and low oil content sesames. BMC Genet. 2019;20:45. doi: 10.1186/s12863-019-0747-7. - DOI - PMC - PubMed
    1. Santi C., Molesini B., Guzzo F., Pii Y., Vitulo N., Pandolfini T. Genome-wide transcriptional changes and lipid profile modifications induced by Medicago truncatula n5 overexpression at an early stage of the symbiotic interaction with Sinorhizobium meliloti. Genes. 2017;8:396. doi: 10.3390/genes8120396. - DOI - PMC - PubMed

MeSH terms