. 2021 May 18;11(5):751.
doi: 10.3390/biom11050751.

Paternal High-Protein Diet Programs Offspring Insulin Sensitivity in a Sex-Specific Manner

Affiliations

Paternal High-Protein Diet Programs Offspring Insulin Sensitivity in a Sex-Specific Manner

Pengfei Gong et al. Biomolecules. .

Abstract

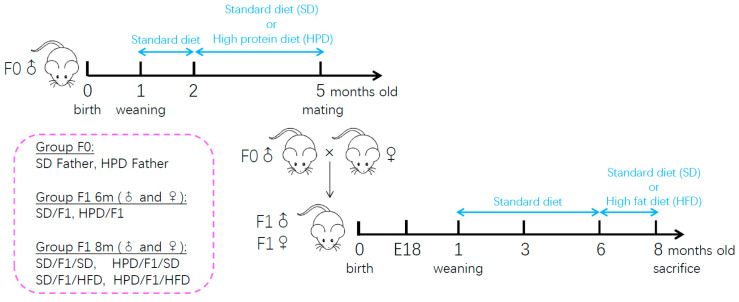
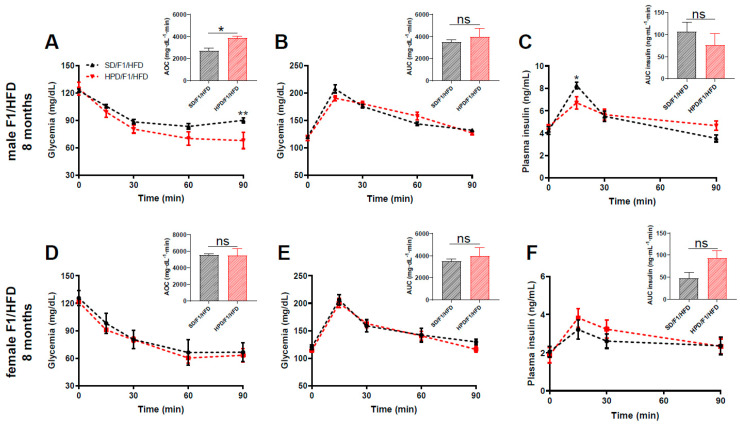
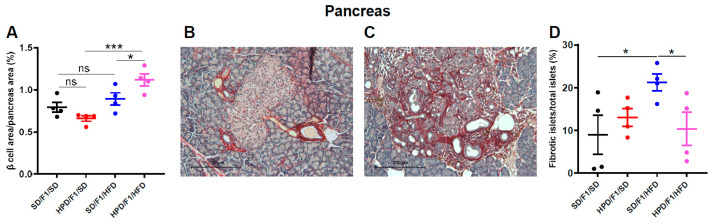
The impact of maternal nutrition on offspring is well documented. However, the implication of pre-conceptional paternal nutrition on the metabolic health of the progeny remains underexplored. Here, we investigated the impact of paternal high-protein diet (HPD, 43.2% protein) consumption on the endocrine pancreas and the metabolic phenotype of offspring. Male Wistar rats were given HPD or standard diet (SD, 18.9% protein) for two months. The progenies (F1) were studied at fetal stage and in adulthood. Body weight, glycemia, glucose tolerance (GT), glucose-induced insulin secretion in vivo (GIIS) and whole-body insulin sensitivity were assessed in male and female F1 offspring. Insulin sensitivity, GT and GIIS were similar between F1 females from HPD (HPD/F1) and SD fathers (SD/F1). Conversely, male HPD/F1 exhibited increased insulin sensitivity (p < 0.05) and decreased GIIS (p < 0.05) compared to male SD/F1. The improvement of insulin sensitivity in HPD/F1 was sustained even after 2 months of high-fat feeding. In male HPD/F1, the β cell mass was preserved and the β cell plasticity, following metabolic challenge, was enhanced compared to SD/F1. In conclusion, we provide the first evidence of a sex-specific impact of paternal HPD on the insulin sensitivity and GIIS of their descendants, demonstrating that changes in paternal nutrition alter the metabolic status of their progeny in adulthood.

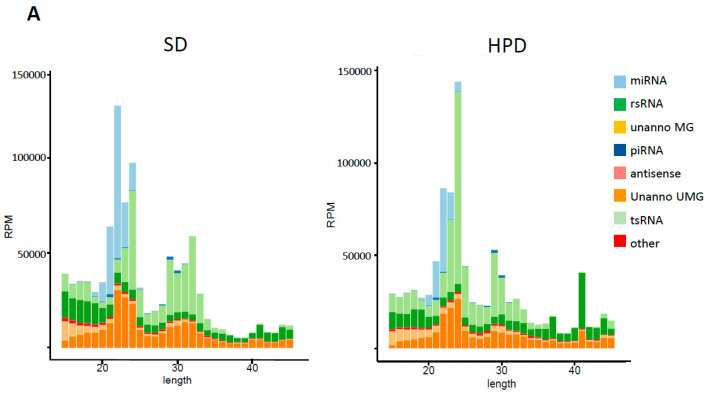
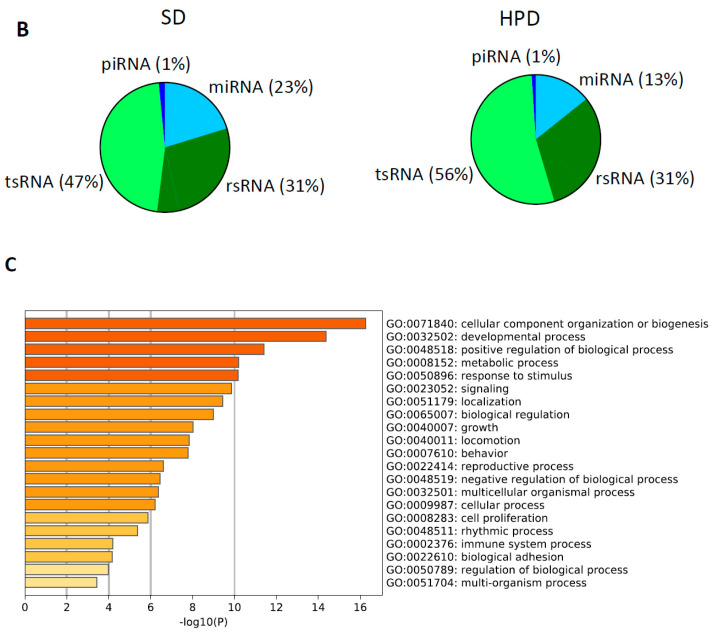
Keywords: endocrine pancreas; glucose homeostasis; high-protein diet; insulin secretion; insulin sensitivity; paternal programming; sperm small non-coding RNAs.


Conflict of interest statement

The authors declare no conflict of interest associated with this manuscript.

Figures

Figure 1
Figure 1
Schematic diagram of the experimental design.
Figure 2
Figure 2
Evolution of body weight, food intake, blood glucose level, body composition and parameters of glucose homeostasis in HPD and SD fathers. Ten-week-old male Wistar rats were fed with high protein diet (HPD) or standard diet (SD) for up to 12 weeks (HPD Father, n = 8; SD Father, n = 6). (A) Body weight, (B) food intake and (C) glycemia were monitored weekly in HPD and SD rats. (D) Body composition, (E) insulin tolerance test (insulin, 0.5 U/kg body weight), (F) intraperitoneal glucose tolerance test (glucose, 1 g/kg body weight) and (G) measurement of glucose-induced insulin secretion (GIIS) were performed after 12 weeks of HPD feeding. Results are expressed as means ± SEM. * p < 0.05, ** p < 0.01 and *** p < 0.001.
Figure 2
Figure 2
Evolution of body weight, food intake, blood glucose level, body composition and parameters of glucose homeostasis in HPD and SD fathers. Ten-week-old male Wistar rats were fed with high protein diet (HPD) or standard diet (SD) for up to 12 weeks (HPD Father, n = 8; SD Father, n = 6). (A) Body weight, (B) food intake and (C) glycemia were monitored weekly in HPD and SD rats. (D) Body composition, (E) insulin tolerance test (insulin, 0.5 U/kg body weight), (F) intraperitoneal glucose tolerance test (glucose, 1 g/kg body weight) and (G) measurement of glucose-induced insulin secretion (GIIS) were performed after 12 weeks of HPD feeding. Results are expressed as means ± SEM. * p < 0.05, ** p < 0.01 and *** p < 0.001.
Figure 3
Figure 3
Body weight and pancreatic parameters of male and female fetal progenies from HPD and SD fathers at embryonic day 18 post-conception (E18). After 2 months of specific diet, HPD and SD fathers were mated with Wistar females fed with a standard diet. F1 male and female offspring were studied separately at the embryonic day 18 post-conception (E18). (A) Body weight, (B) pancreas weight and (C) the relative β cell area of male and female F1 fetuses at E18. SD/F1: offspring from SD father; HPD/F1: offspring from HPD father. Results are expressed as means ± SEM. n = 14–20 (A,B); n = 4 (C). **** p < 0.0001.
Figure 4
Figure 4
Parameters of glucose metabolism in 3 months old and 6 months old F1 from HPD and SD fathers. (A) Insulin tolerance test in male HPD/F1 and SD/F1 at the age of 3 months, (B) intraperitoneal glucose tolerance test in male HPD/F1 and SD/F1 at 3 months old and (C) glucose-induced insulin secretion in male F1 during IPGTT at the age of 3 months. (D) Insulin tolerance test in female HPD/F1 and SD/F1 at the age of 3 months, (E) intraperitoneal glucose tolerance test in female HPD/F1 and SD/F1 at the age of 3 months and (F) glucose-induced insulin secretion of female F1 during IPGTT at the age of 3 months. (G) Insulin tolerance test in male HPD/F1 and SD/F1 at the age of 6 months, (H) intraperitoneal glucose tolerance test in male HPD/F1 and SD/F1 at the age of 6 months and (I) glucose-induced insulin secretion in male F1 during IPGTT at the age of 6 months. (J) Insulin tolerance test in female HPD/F1 and SD/F1 at the age of 6 months, (K) intraperitoneal glucose tolerance test in female HPD/F1 and SD/F1 at the age of 6 months and (L) glucose-induced insulin secretion of female F1 during intraperitoneal glucose tolerance test at the age of 6 months. Area over the curve (AOC) (A,D,G,J) and area under the curve (AUC) (B,C,E,F,H,I,K,L) are shown in the insert. For all groups: Insulin tolerance test: insulin, 0.5 U/kg body weight; Intraperitoneal glucose tolerance test: glucose, 1 g/kg body weight. SD/F1: offspring from SD father; HPD/F1: offspring from HPD father. Seven to eleven animals were used in each group. Results are expressed as means ± SEM. * p < 0.05, ** p < 0.01 and *** p < 0.001.
Figure 5
Figure 5
Parameters of glucose metabolism in 8 months old F1 from HPD and SD fathers following metabolic challenge. (A) Insulin tolerance test, (B) intraperitoneal glucose tolerance test and (C) glucose-induced insulin secretion in male HPD/F1/HFD and SD/F1/HFD, at the age of 8 months. (D) Insulin tolerance test, (E) intraperitoneal glucose tolerance test and (F) glucose-induced insulin secretion in female HPD/F1/HFD and SD/F1/HFD, at the age of 8 months. Area over the curve (AOC) (A,D) and area under the curve (AUC) (B,C,E,F) are shown in the insert. For all groups: Insulin tolerance test: insulin, 0.5 U/kg body weight; Intraperitoneal glucose tolerance test: glucose, 1 g/kg body weight. SD/F1/HFD: offspring from SD father fed with HFD; HPD/F1/HFD: offspring from HPD father fed with HFD. Four to six animals were analyzed in each experimental group. Results are expressed as means ± SEM. * p < 0.05 and ** p < 0.01.
Figure 6
Figure 6
Pancreatic parameters and gene expression study in male offspring from SD and HPD fathers, before and after metabolic challenge. Morphometric analysis of β cells was performed on pancreatic sections of male SD/F1/SD, HPD/F1/SD, SD/F1/HFD and HPD/F1/HFD, at the age of 8 months. (A) The relative β cell area over total pancreas area was measured. (B) To detect islet fibrosis, pancreatic sections of 8 months old male SD/F1/HFD and (C) HPD/F1/HFD were stained with Picro Sirius Red solution, followed by counterstaining with Papanicolau’s solution. (D) Quantification of fibrosis expressed as the percentage of fibrotic islets over total number of islets per pancreas. Real-time PCR in male SD/F1/SD, HPD/F1/SD, SD/F1/HFD and HPD/F1/HFD at the age of 8 months was performed on samples from liver (E,F,G,H) and epididymal adipose tissue (I,J,K,L) for the indicated genes, and normalized to Cyclophilin A. The experiments were performed in duplicates. Four to five rats were analyzed in each experimental group. Results are expressed as means ± SEM. * p < 0.05, ** p < 0.01, *** p < 0.001.
Figure 6
Figure 6
Pancreatic parameters and gene expression study in male offspring from SD and HPD fathers, before and after metabolic challenge. Morphometric analysis of β cells was performed on pancreatic sections of male SD/F1/SD, HPD/F1/SD, SD/F1/HFD and HPD/F1/HFD, at the age of 8 months. (A) The relative β cell area over total pancreas area was measured. (B) To detect islet fibrosis, pancreatic sections of 8 months old male SD/F1/HFD and (C) HPD/F1/HFD were stained with Picro Sirius Red solution, followed by counterstaining with Papanicolau’s solution. (D) Quantification of fibrosis expressed as the percentage of fibrotic islets over total number of islets per pancreas. Real-time PCR in male SD/F1/SD, HPD/F1/SD, SD/F1/HFD and HPD/F1/HFD at the age of 8 months was performed on samples from liver (E,F,G,H) and epididymal adipose tissue (I,J,K,L) for the indicated genes, and normalized to Cyclophilin A. The experiments were performed in duplicates. Four to five rats were analyzed in each experimental group. Results are expressed as means ± SEM. * p < 0.05, ** p < 0.01, *** p < 0.001.
Figure 7
Figure 7
Deep sequencing analysis of small RNAs from SD and HPD spermatozoa. (A) Length distribution of small RNAs from SD and HPD spermatozoa. (B) Mean proportion of each small RNA population across each group (n = 3). (C) Enrichment of biological categories with 2464 gene targets of deregulated miRNAs in the HPD spermatozoa.
Figure 7
Figure 7
Deep sequencing analysis of small RNAs from SD and HPD spermatozoa. (A) Length distribution of small RNAs from SD and HPD spermatozoa. (B) Mean proportion of each small RNA population across each group (n = 3). (C) Enrichment of biological categories with 2464 gene targets of deregulated miRNAs in the HPD spermatozoa.

Similar articles

Cited by

References

    1. Barker D. Developmental Origins of Adult Health and Disease. J. Epidemiol. Community Health. 2004;58:114–115. doi: 10.1136/jech.58.2.114. - DOI - PMC - PubMed
    1. Barker D.J.P. The Origins of the Developmental Origins Theory. J. Intern. Med. 2007;261:412–417. doi: 10.1111/j.1365-2796.2007.01809.x. - DOI - PubMed
    1. Soubry A. POHaD: Why We Should Study Future Fathers. Environ. Epigenet. 2018;4 doi: 10.1093/eep/dvy007. - DOI - PMC - PubMed
    1. Dunford A.R., Sangster J.M. Maternal and Paternal Periconceptional Nutrition as an Indicator of Offspring Metabolic Syndrome Risk in Later Life through Epigenetic Imprinting: A Systematic Review. Diabetes Metab. Syndr. Clin. Res. Rev. 2017;11:S655–S662. doi: 10.1016/j.dsx.2017.04.021. - DOI - PubMed
    1. Ng S.-F., Lin R.C.Y., Laybutt D.R., Barres R., Owens J.A., Morris M.J. Chronic High-Fat Diet in Fathers Programs β-Cell Dysfunction in Female Rat Offspring. Nature. 2010;467:963–966. doi: 10.1038/nature09491. - DOI - PubMed

Publication types