. 2021 May 18;11(5):752.
doi: 10.3390/biom11050752.

Proton Detected Solid-State NMR of Membrane Proteins at 28 Tesla (1.2 GHz) and 100 kHz Magic-Angle Spinning

Affiliations

Proton Detected Solid-State NMR of Membrane Proteins at 28 Tesla (1.2 GHz) and 100 kHz Magic-Angle Spinning

Evgeny Nimerovsky et al. Biomolecules. .

Abstract

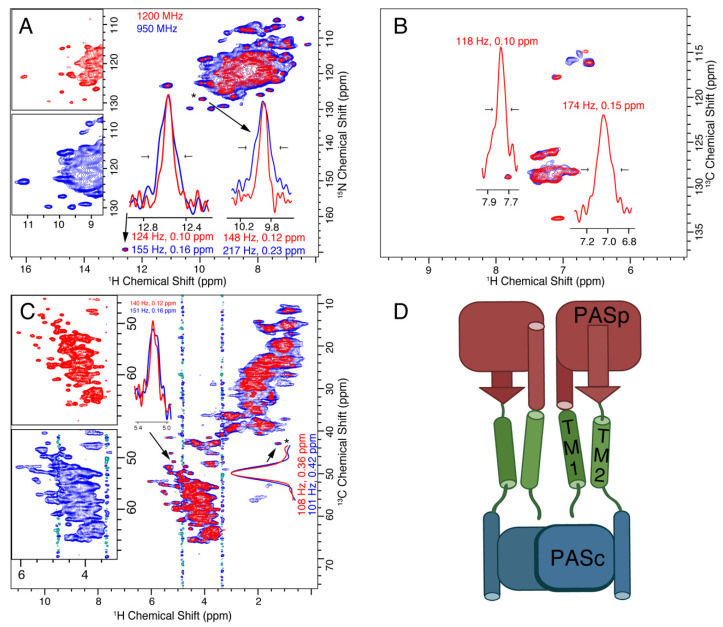
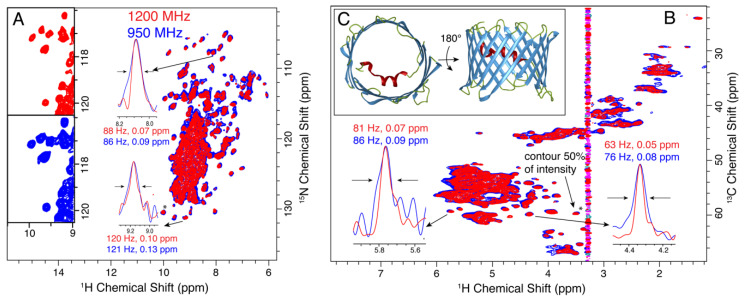
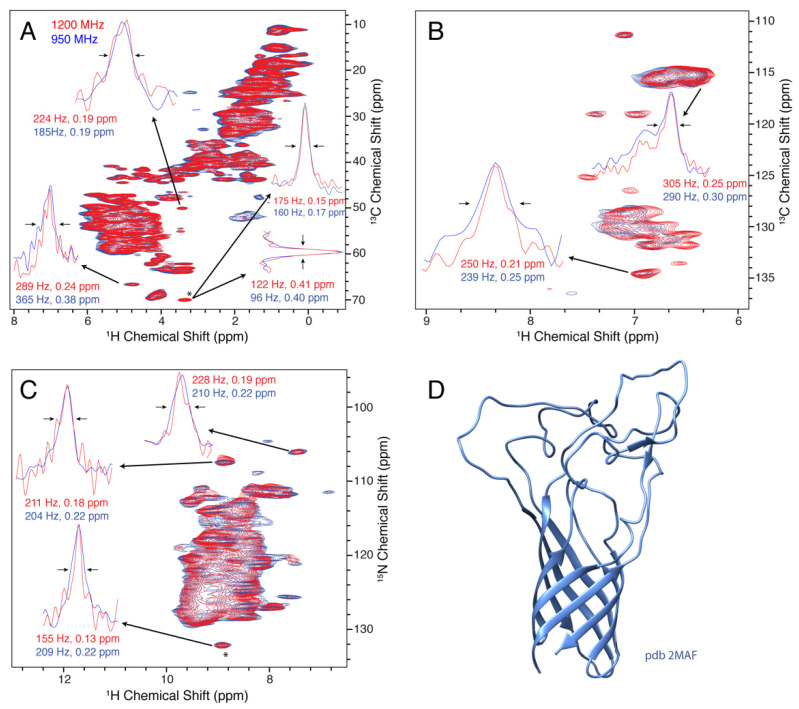
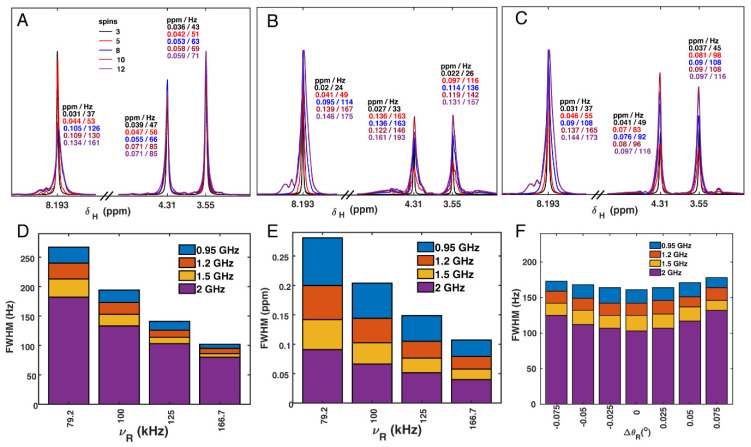
The available magnetic field strength for high resolution NMR in persistent superconducting magnets has recently improved from 23.5 to 28 Tesla, increasing the proton resonance frequency from 1 to 1.2 GHz. For magic-angle spinning (MAS) NMR, this is expected to improve resolution, provided the sample preparation results in homogeneous broadening. We compare two-dimensional (2D) proton detected MAS NMR spectra of four membrane proteins at 950 and 1200 MHz. We find a consistent improvement in resolution that scales superlinearly with the increase in magnetic field for three of the four examples. In 3D and 4D spectra, which are now routinely acquired, this improvement indicates the ability to resolve at least 2 and 2.5 times as many signals, respectively.

Keywords: beta barrel; high magnetic field; magic-angle spinning; membrane protein; proton detection; solid-state NMR; transmembrane.


Conflict of interest statement

The authors declare no conflict of interest.

Figures

Figure 1
Figure 1
Spectra of fully protonated Influenza A M2 recorded at 950 (blue) and 1200 (red) MHz spectrometers using 100 kHz MAS. Panel (A) shows the CP based C-H spectrum, (H)CH, and the slice shows linewidths of G34 α protons. In (B), the aromatic region of the same spectrum is shown. Panel (C) shows the CP-based N-H spectrum and linewidths of selected peaks. The insets show the linewidths of selected peaks that are resolved in the 2D spectrum. The peak indicated with a (*) was used to set the base contour level to a consistent fraction of the peak intensity for each set of overlaid spectra. In (D), the tetrameric structure of M2 is shown, taking the coordinates from protein data bank (PDB) code 2N70, which contains the S31N substitution, but shows a similar ‘dimer-of-dimers’ spectrum as the wild type sequence for which the spectra were recorded.
Figure 2
Figure 2
Resolution and sensitivity of CitApc (H)NH and (H)CH spectra are improved using the 1200 MHz instrument (red) as compared with the 950 MHz (blue). The resulting improvement in peak separation is evident in both the (H)NH (A) and (H)CH (B,C) spectra. The expansion of the alpha region is shown side-by-side. This is especially obvious in the glycine region of the (H)NH spectra below 110 ppm. 1D proton traces (inset in (AC)) reveal the resolution improvement of various isolated peaks. The aromatic carbon region of the (H)CH spectrum (B) has a sensitivity at the 950 MHz magnet, that was too low for reliable linewidth measurement. The insets show the linewidths of selected peaks that are resolved in the 2D spectrum. The peak indicated with a (*) was used to set the base contour level to a consistent fraction of the peak intensity for each set of overlaid spectra. The topology of the protein is shown in (D) with the sensor PASp domain in red, the transmembrane helices (TM1 and TM2) shown in green, and the PASc domain shown in blue. The t1 noise at about 3.3 and 4.7 ppm are from choline and water protons, respectively.
Figure 3
Figure 3
Improved resolution of 2D crystalline α-PET hVDAC at 1200 MHz (red) compared with 950 MHz (blue). (A,B) show the (H)NH and (H)CH spectra, respectively. An expanded view in (A) shows the spectra side by side. The inlays show the improvement in line widths on the ppm scale for proton. The insets show the linewidths of selected peaks that are resolved in the 2D spectrum. The peak indicated with a (*) was used to set the base contour level to a consistent fraction of the peak intensity for each set of overlaid spectra. Panel (C) Shows the 3D structure of VDAC (pdb: 3EMN). α-helical regions are shown in red, β-strands in blue, loops in green. The t1 noise at about 3.3 ppm is from choline protons.
Figure 4
Figure 4
Resolution of the beta barrel protein Opa60 at 1200 MHz (red) and 950 MHz (blue). (AC) show the aliphatic (H)CH, aromatic (H)CH, and (H)NH spectra, respectively. The insets show the linewidths of selected peaks that are resolved in the 2D spectrum. The peak indicated with a (*) was used to set the base contour level to a consistent fraction of the peak intensity for each set of overlaid spectra. In (D), the solution structure (pdb 2MAF) is shown.
Figure 5
Figure 5
Average proton linewidth for the four membrane proteins, Opa60, hVDAC, CitA, and M2, based on a random selection of well-isolated peaks. The red lines indicate the hypothetical linewidth at 1200 MHz, calculated based on the measured lines at 950 MHz and the ratio between the external fields (the case where the linewidth hypothetically stays the same when measured in Hz). The vertical lines show the variance in linewidth among the selected peaks.
Figure 6
Figure 6
Nitrogen linewidths of the four proteins. Red spectra are from the 1200 MHz instrument, while blue spectra were recorded at 950 MHz. The proteins are indicated in the top left of each panel, VDAC, M2, Opa60, and CitA.
Figure 7
Figure 7
Simulated spectra of glycine protons (G34), with different sets of spins included. The simulated spectra in (AC) were for the 1200 MHz magnet with 100 kHz MAS. In (A), the closest 3 to 12 spins from pdb 2N70 were included stepwise (details in the Supplementary Materials Table S3). In B and C, two additional protons were added to fill a void near the G34 Hα protons. In (B), these additional protons had chemical shift offsets of 4.6 ppm, whereas in (C), chemical shift offsets were set according to a DFT calculation (details in the Supplementary Materials). In (D), the full linewidth at half max (FWHM) of the amide proton is shown for four fields and MAS frequencies, with units of Hz. 12 spins were simulated. In (E), the same linewidths are shown in ppm. Panel (F) shows the sensitivity of the amide proton to magic angle misset. 12 spins were simulated at a spinning frequency of 100 kHz, for the indicated spectrometer frequencies. For (AE), 32 Hz Lorentzian line broadening was applied, and for (F), 16 Hz was applied, since the panel represents the linewidth in a spin echo.

References

    1. Bodenhausen G., Ruben D.J. Natural abundance nitrogen-15 NMR by enhanced heteronuclear spectroscopy. Chem. Phys. Lett. 1980;69:185–189. doi: 10.1016/0009-2614(80)80041-8. - DOI
    1. Ishii Y., Yesinowski J.P., Tycko R. Sensitivity enhancement in solid-state (13)C NMR of synthetic polymers and biopolymers by (1)H NMR detection with high-speed magic angle spinning. J. Am. Chem. Soc. 2001;123:2921–2922. doi: 10.1021/ja015505j. - DOI - PubMed
    1. Maricq M.M., Waugh J.S. NMR in rotating solids. J. Chem. Phys. 1979;70:3300–3316. doi: 10.1063/1.437915. - DOI
    1. Chevelkov V., Rehbein K., Diehl A., Reif B. Ultrahigh resolution in proton solid-state NMR spectroscopy at high levels of deuteration. Angew. Chem. Int. Ed. Engl. 2006;45:3878–3881. doi: 10.1002/anie.200600328. - DOI - PubMed
    1. Chevelkov V., van Rossum B.J., Castellani F., Rehbein K., Diehl A., Hohwy M., Steuernagel S., Engelke F., Oschkinat H., Reif B. 1H detection in MAS solid-state NMR spectroscopy of biomacromolecules employing pulsed field gradients for residual solvent suppression. J. Am. Chem. Soc. 2003;125:7788–7789. doi: 10.1021/ja029354b. - DOI - PubMed

Publication types

MeSH terms

Supplementary concepts

LinkOut - more resources