

Loss of PGRMC1 Delays the Progression of Hepatocellular Carcinoma via Suppression of Pro-Inflammatory Immune Responses
- PMID: 34069911
- PMCID: PMC8157610
- DOI: 10.3390/cancers13102438
Loss of PGRMC1 Delays the Progression of Hepatocellular Carcinoma via Suppression of Pro-Inflammatory Immune Responses
Abstract
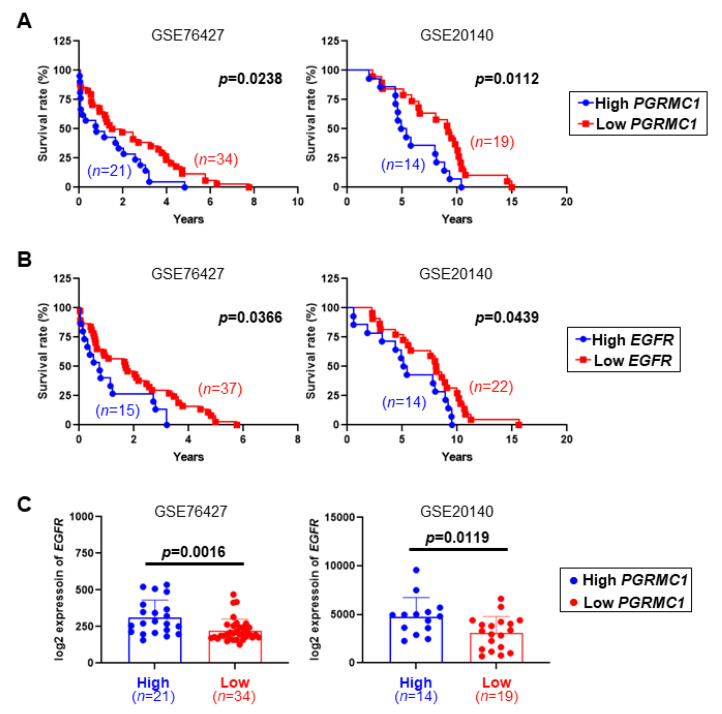
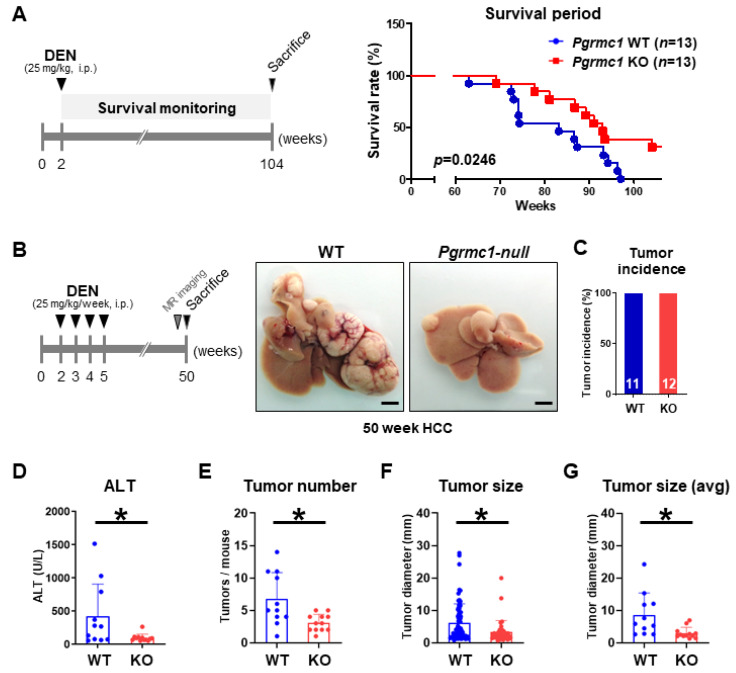
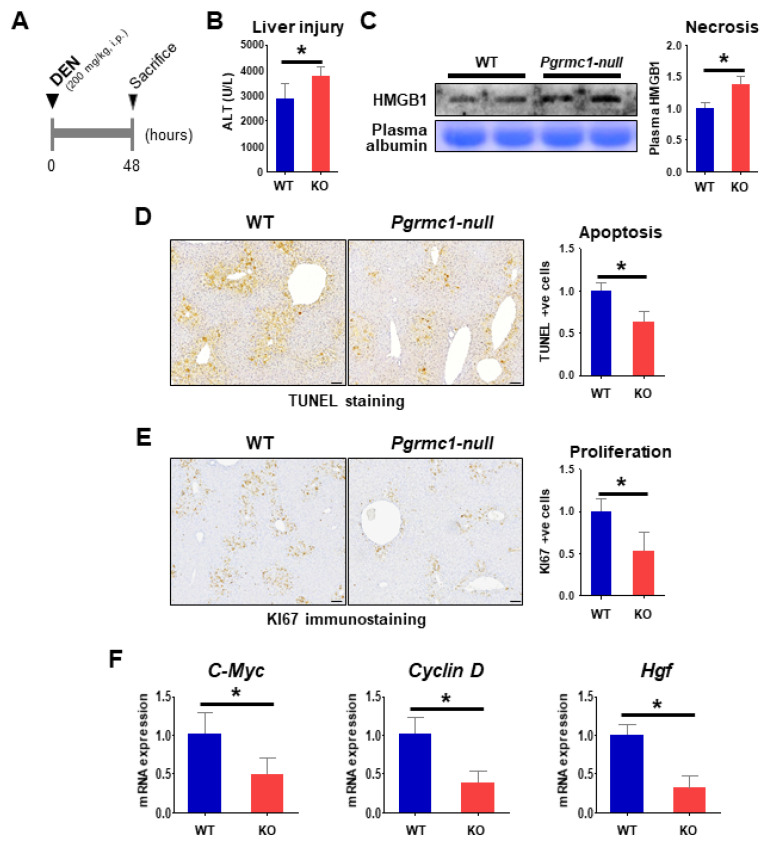
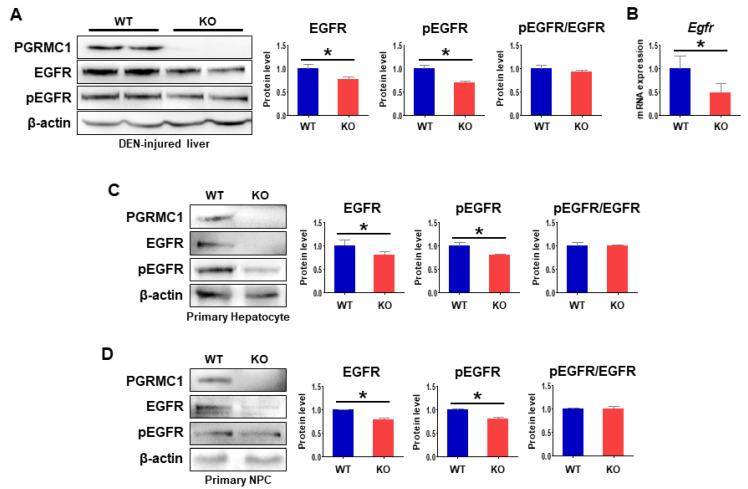
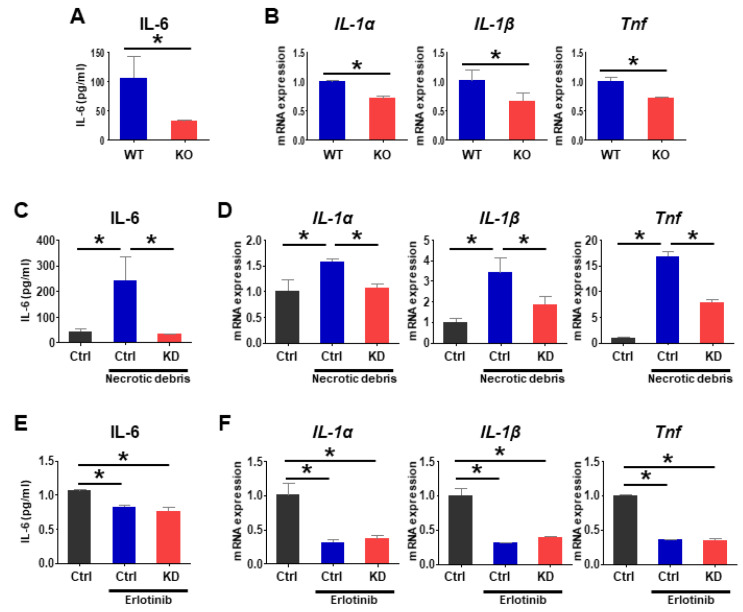
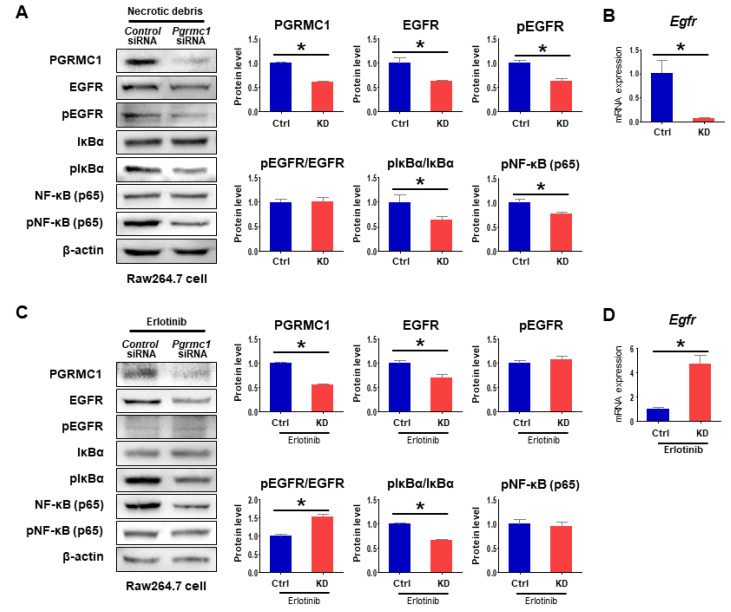
Pgrmc1 is a non-canonical progesterone receptor related to the lethality of various types of cancer. PGRMC1 has been reported to exist in co-precipitated protein complexes with epidermal growth factor receptor (EGFR), which is considered a useful therapeutic target in hepatocellular carcinoma (HCC). Here, we investigated whether Pgrmc1 is involved in HCC progression. In clinical datasets, PGRMC1 transcription level was positively correlated with EGFR levels; importantly, PGRMC1 level was inversely correlated with the survival duration of HCC patients. In a diethylnitrosamine (DEN)-induced murine model of HCC, the global ablation of Pgrmc1 suppressed the development of HCC and prolonged the survival of HCC-bearing mice. We further found that increases in hepatocyte death and suppression of compensatory proliferation in the livers of DEN-injured Pgrmc1-null mice were concomitant with decreases in nuclear factor κB (NF-κB)-dependent production of interleukin-6 (IL-6). Indeed, silencing of Pgrmc1 in murine macrophages led to reductions in NF-κB activity and IL-6 production. We found that the anti-proinflammatory effect of Pgrmc1 loss was mediated by reductions in EGFR level and its effect was not observed after exposure of the EGFR inhibitor erlotinib. This study reveals a novel cooperative role of Pgrmc1 in supporting the EGFR-mediated development of hepatocellular carcinoma, implying that pharmacological suppression of Pgrmc1 may be a useful strategy in HCC treatment.
Keywords: EGFR; HCC; Pgrmc1; inflammation; liver cancer.
Conflict of interest statement
The authors declare no conflict of interest.
Figures
Similar articles
-
Progesterone receptor membrane component 1 leads to erlotinib resistance, initiating crosstalk of Wnt/β-catenin and NF-κB pathways, in lung adenocarcinoma cells.Sci Rep. 2020 Mar 16;10(1):4748. doi: 10.1038/s41598-020-61727-3. Sci Rep. 2020. PMID: 32179851 Free PMC article.
-
Loss of immunity-supported senescence enhances susceptibility to hepatocellular carcinogenesis and progression in Toll-like receptor 2-deficient mice.Hepatology. 2013 Jan;57(1):171-82. doi: 10.1002/hep.25991. Hepatology. 2013. PMID: 22859216
-
Progesterone receptor membrane component 1 as a potential prognostic biomarker for hepatocellular carcinoma.World J Gastroenterol. 2018 Mar 14;24(10):1152-1166. doi: 10.3748/wjg.v24.i10.1152. World J Gastroenterol. 2018. PMID: 29563759 Free PMC article.
-
Abberent expression of NOR1 protein in tumor associated macrophages contributes to the development of DEN-induced hepatocellular carcinoma.J Cell Physiol. 2018 Jun;233(6):5002-5013. doi: 10.1002/jcp.26349. Epub 2018 Jan 4. J Cell Physiol. 2018. PMID: 29227538
-
S2R(Pgrmc1): the cytochrome-related sigma-2 receptor that regulates lipid and drug metabolism and hormone signaling.Expert Opin Drug Metab Toxicol. 2012 Mar;8(3):361-70. doi: 10.1517/17425255.2012.658367. Epub 2012 Feb 1. Expert Opin Drug Metab Toxicol. 2012. PMID: 22292588 Review.
Cited by
-
Pleiotropic Actions of PGRMC Proteins in Cancer.Endocrinology. 2022 Jul 1;163(7):bqac078. doi: 10.1210/endocr/bqac078. Endocrinology. 2022. PMID: 35595324 Free PMC article. Review.
-
Dietary Intake of 17α-Ethinylestradiol Promotes HCC Progression in Humanized Male Mice Expressing Sex Hormone-Binding Globulin.Int J Mol Sci. 2021 Nov 22;22(22):12557. doi: 10.3390/ijms222212557. Int J Mol Sci. 2021. PMID: 34830439 Free PMC article.
-
Gamma-ray irradiation modulates PGRMC1 expression and the number of CD56+ and FoxP3+ cells in the tumor microenvironment of endometrial endometrioid adenocarcinoma.Radiat Oncol J. 2021 Dec;39(4):324-333. doi: 10.3857/roj.2021.00472. Epub 2021 Aug 17. Radiat Oncol J. 2021. PMID: 34986554 Free PMC article.
-
Pleiotropy of Progesterone Receptor Membrane Component 1 in Modulation of Cytochrome P450 Activity.J Xenobiot. 2024 May 1;14(2):575-603. doi: 10.3390/jox14020034. J Xenobiot. 2024. PMID: 38804287 Free PMC article. Review.
-
Quantitative analysis of the UDP-glucuronosyltransferase transcriptome in human tissues.Pharmacol Res Perspect. 2023 Dec;11(6):e01154. doi: 10.1002/prp2.1154. Pharmacol Res Perspect. 2023. PMID: 37983911 Free PMC article.
References
-
- Capece D., Fischietti M., Verzella D., Gaggiano A., Cicciarelli G., Tessitore A., Zazzeroni F., Alesse E. The inflammatory microenvironment in hepatocellular carcinoma: A pivotal role for tumor-associated macrophages. Biomed. Res. Int. 2013;2013:187204. doi: 10.1155/2013/187204. - DOI - PMC - PubMed
Grants and funding
LinkOut - more resources
Full Text Sources
Research Materials
Miscellaneous
