. 2021 May 18;10(5):1114.
doi: 10.3390/foods10051114.

The Food Contaminants Pyrrolizidine Alkaloids Disturb Bile Acid Homeostasis Structure-Dependently in the Human Hepatoma Cell Line HepaRG

Affiliations

The Food Contaminants Pyrrolizidine Alkaloids Disturb Bile Acid Homeostasis Structure-Dependently in the Human Hepatoma Cell Line HepaRG

Josephin Glück et al. Foods. .

Abstract

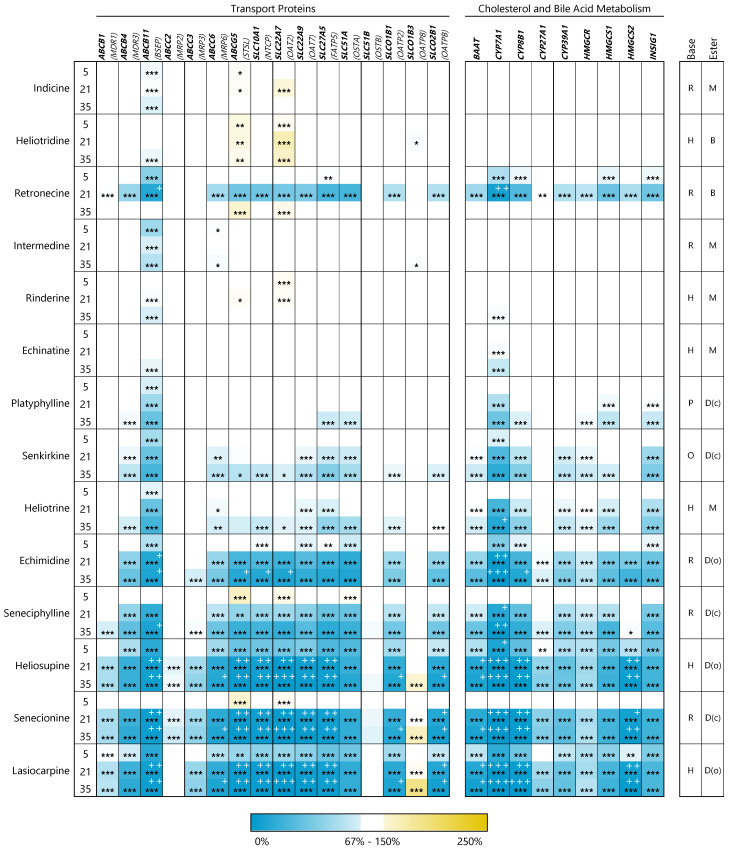
Pyrrolizidine alkaloids (PAs) are a group of secondary plant metabolites being contained in various plant species. The consumption of contaminated food can lead to acute intoxications in humans and exert severe hepatotoxicity. The development of jaundice and elevated bile acid concentrations in blood have been reported in acute human PA intoxication, indicating a connection between PA exposure and the induction of cholestasis. Additionally, it is considered that differences in toxicity of individual PAs is based on their individual chemical structures. Therefore, we aimed to elucidate the structure-dependent disturbance of bile acid homeostasis by PAs in the human hepatoma cell line HepaRG. A set of 14 different PAs, including representatives of all major structural characteristics, namely, the four different necine bases retronecine, heliotridine, otonecine and platynecine and different grades of esterification, was analyzed in regard to the expression of genes involved in bile acid synthesis, metabolism and transport. Additionally, intra- and extracellular bile acid levels were analyzed after PA treatment. In summary, our data show significant structure-dependent effects of PAs on bile acid homeostasis. Especially PAs of diester type caused the strongest dysregulation of expression of genes associated with cholestasis and led to a strong decrease of intra- and extracellular bile acid concentrations.

Keywords: bile acids; cholestasis; hepatotoxicity; pyrrolizidine alkaloids; structure dependency.


Conflict of interest statement

The authors declare no conflict of interest.

Figures

Figure 1
Figure 1
Overview of different PAs and their structural characteristics sorted by their grade of esterification: (A)—free bases; (B)—monoesters; (C)—open-chained diesters; (D)—cyclic diesters. The respective type of necine base is indicated in brackets: H—heliotrine (7S); O—otonecine (7R); P—platynecine (7R); R—retronecine (7R). The only 1,2-saturated PA, platyphylline, is indicated in italics. For cytotoxicity studies, all listed esters and the free bases heliotridine and retronecine were analyzed. The bold and underlined PAs represent the reduced test set for all subsequent experiments.
Figure 2
Figure 2
Decreasing viability of HepaRG cells 24 h after PA exposure. Cell viability was measured by the MTT assay. The mean values out of three biological replicates with three technical replicates each were normalized to the solvent control (SC, 2.5% ACN, 1.7% DMSO). Triton X-100 (0.05%) was used as positive control (PC). The heat map shows the cell viabilities in percent of the solvent control. Blue color indicates a decrease in cell viability and yellow indicates an increase. Statistics: * p < 0.05, ** p < 0.01, *** p < 0.001 (one-way ANOVA followed by Dunnett‘s post hoc test versus the solvent control). Mean values, standard deviations and p-values can be found in the supplemental material. Abbreviations for structural characteristics of the PAs: retronecine (R), heliotrine (H), otonecine (O) or platynecine (P) type; free base (B), monoester (M), open-chained diester (D(o)) or cyclic diester (D(c)).
Figure 3
Figure 3
Changes in expression of cholestasis-associated genes after PA treatment of HepaRG cells for 24 h. Differentiated HepaRG were treated with PAs in concentrations of 5, 21 and 35 µM. The Ct-values were evaluated according to the 2-ΔΔCt method by normalizing Ct-values of the respective gene to the housekeeping gene β-glucuronidase (GUSB) and by referring to solvent-treated cells (0.35% ACN and 0.5% DMSO). The cutoff for gene expression regulation was set from 67% to 150% of solvent control. Changes in gene expression within this range were considered not to be biologically relevant. The cells of the heat map show the changes in gene expression of the target genes in percent of the solvent control as means of three replicates. Blue color indicates a downregulation and yellow color an upregulation of gene expression. Expression levels below 10% of solvent control are additionally highlighted by white + (+ expression level below 10%; ++ expression level below 5%; +++ expression level below 1%). Statistics: * p < 0.05, ** p < 0.01, *** p < 0.001 (one-way ANOVA followed by Dunnett‘s post hoc analysis versus the respective solvent control). Mean values, standard deviations and p-values are summarized in the supplemental material (Table S3), as well as the sequences of used primers and the full-length names and synonyms of the detected genes (Table S2). Structural characteristics: retronecine (R), heliotrine (H), otonecine (O) or platynecine (P) type; free base (B), monoester (M), open-chained diester (D(o)) or cyclic diester (D(c)).
Figure 3
Figure 3
Changes in expression of cholestasis-associated genes after PA treatment of HepaRG cells for 24 h. Differentiated HepaRG were treated with PAs in concentrations of 5, 21 and 35 µM. The Ct-values were evaluated according to the 2-ΔΔCt method by normalizing Ct-values of the respective gene to the housekeeping gene β-glucuronidase (GUSB) and by referring to solvent-treated cells (0.35% ACN and 0.5% DMSO). The cutoff for gene expression regulation was set from 67% to 150% of solvent control. Changes in gene expression within this range were considered not to be biologically relevant. The cells of the heat map show the changes in gene expression of the target genes in percent of the solvent control as means of three replicates. Blue color indicates a downregulation and yellow color an upregulation of gene expression. Expression levels below 10% of solvent control are additionally highlighted by white + (+ expression level below 10%; ++ expression level below 5%; +++ expression level below 1%). Statistics: * p < 0.05, ** p < 0.01, *** p < 0.001 (one-way ANOVA followed by Dunnett‘s post hoc analysis versus the respective solvent control). Mean values, standard deviations and p-values are summarized in the supplemental material (Table S3), as well as the sequences of used primers and the full-length names and synonyms of the detected genes (Table S2). Structural characteristics: retronecine (R), heliotrine (H), otonecine (O) or platynecine (P) type; free base (B), monoester (M), open-chained diester (D(o)) or cyclic diester (D(c)).
Figure 4
Figure 4
Changes in the intra- and extracellular bile acid concentration after PA treatment for 48 h. Differentiated HepaRG cells were treated with PAs in concentrations of 5, 21 and 35 µM under serum-free conditions. The cells of the heat map are colored according to the relative change of the respective bile acid as mean of three replicates compared to untreated cells (solvent control, 0.35% ACN and 1.7% DMSO). An increase is indicated by yellow color and blue filling indicates a decrease compared to the solvent control (100%). Cyclosporine A (20 µM) was used as positive control (PC) for the induction of cholestasis [46]. Bile acid levels below 10% of solvent control are additionally highlighted by white + (+ below 10%; ++ below 5%; +++ below 1%). Statistics: * p < 0.05, ** p < 0.01, *** p < 0.001 (one-way ANOVA followed by Dunnett‘s post hoc analysis versus the respective solvent control). Mean values, standard deviations and p-values are summarized in the supplemental material (Table S4). Structural characteristics: retronecine (R), heliotrine (H), otonecine (O) or platynecine (P) type; free base (B), monoester (M), open-chained diester (D(o)) or cyclic diester (D(c)). Abbreviations for measured bile acids: cholic acid (CA), glycocholic acid (GCA), taurocholic acid (TCA), chenodeoxycholic acid (CDCA), glycochenodeoxycholic acid (GCDCA), taurochenodeoxycholic acid (TCDCA).

Similar articles

Cited by

References

    1. BfR Pyrrolizidine alkaloids in herbal teas and teas. BfR Opin. 2013;2013:1–31.
    1. Edgar J.A., Roeder E., Molyneux R.J. Honey from plants containing pyrrolizidine alkaloids: A potential threat to health. J. Agric. Food Chem. 2002;50:2719–2730. doi: 10.1021/jf0114482. - DOI - PubMed
    1. Kakar F., Akbarian Z., Leslie T., Mustafa M.L., Watson J., van Egmond H.P., Omar M.F., Mofleh J. An outbreak of hepatic veno-occlusive disease in Western afghanistan associated with exposure to wheat flour contaminated with pyrrolizidine alkaloids. J. Toxicol. 2010;2010:313280. doi: 10.1155/2010/313280. - DOI - PMC - PubMed
    1. Bodi D., Ronczka S., Gottschalk C., Behr N., Skibba A., Wagner M., Lahrssen-Wiederholt M., Preiss-Weigert A., These A. Determination of pyrrolizidine alkaloids in tea, herbal drugs and honey. Food Addit. Contam. Part A. 2014;31:1886–1895. doi: 10.1080/19440049.2014.964337. - DOI - PubMed
    1. Mulder P.P.J., Lopez P., Castellari M., Bodi D., Ronczka S., Preiss-Weigert A., These A. Occurrence of pyrrolizidine alkaloids in animal- and plant-derived food: Results of a survey across Europe. Food Addit. Contam. Part A. 2018;35:118–133. doi: 10.1080/19440049.2017.1382726. - DOI - PubMed

LinkOut - more resources