

Propionate Fermentative Genes of the Gut Microbiome Decrease in Inflammatory Bowel Disease
- PMID: 34070019
- PMCID: PMC8157882
- DOI: 10.3390/jcm10102176
Propionate Fermentative Genes of the Gut Microbiome Decrease in Inflammatory Bowel Disease
Abstract
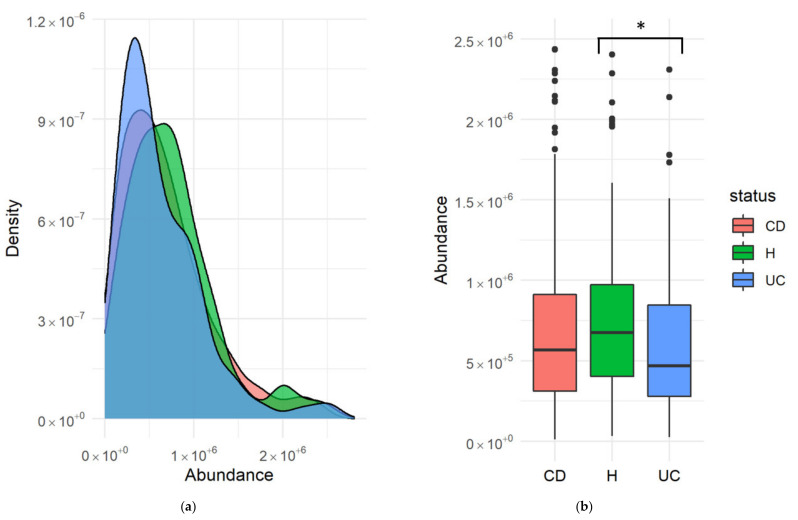
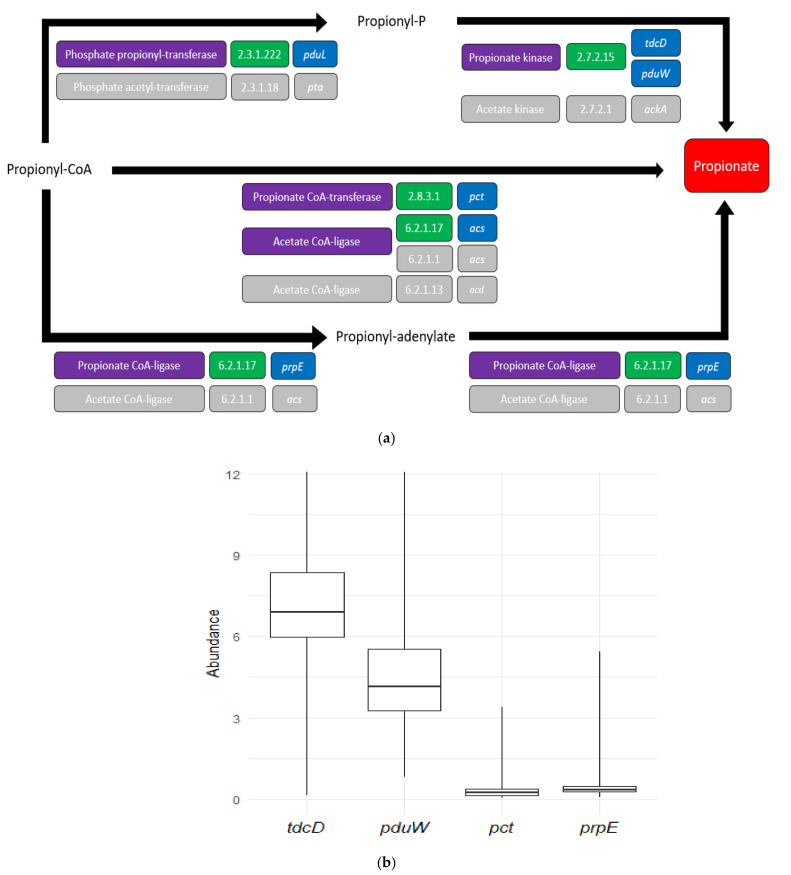
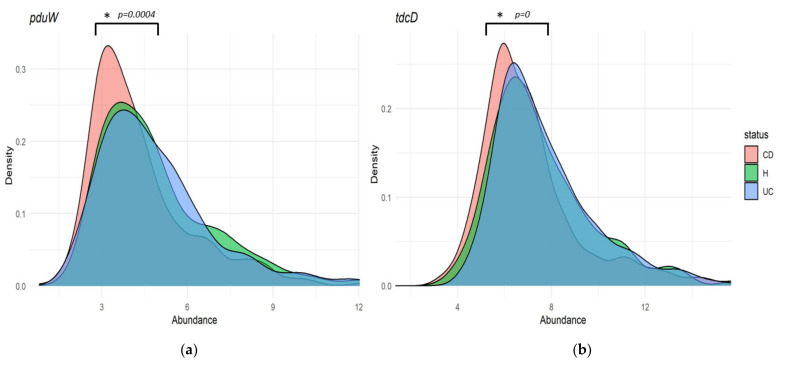
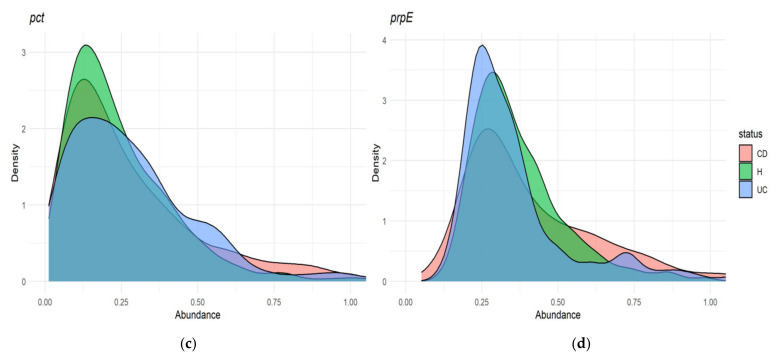
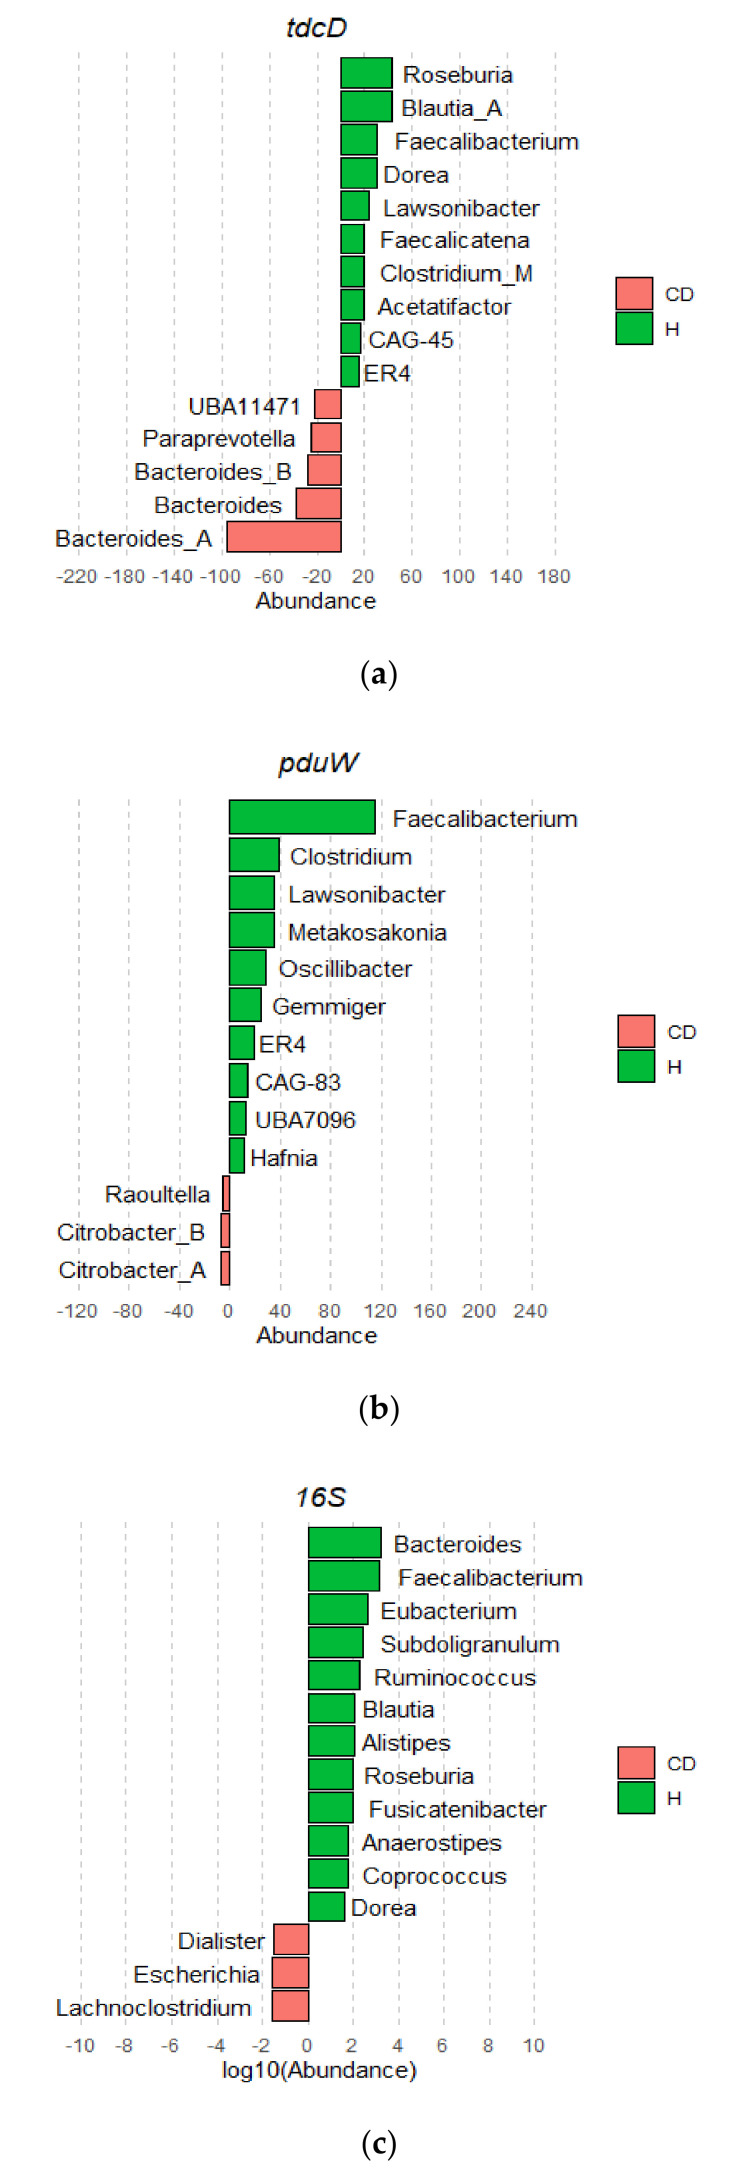
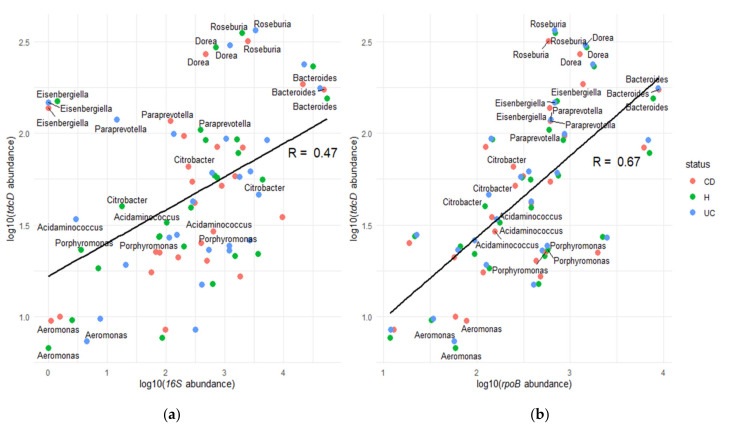
Changes in the gut microbiome have been associated with inflammatory bowel disease. A protective role of short chain fatty acids produced by the gut microbiota has been suggested as a causal mechanism. Nevertheless, multi-omic analyses have failed to identify a clear link between changes in specific taxa and disease states. Recently, metagenomic analyses unveiled that gut bacterial species have a previously unappreciated genomic diversity, implying that a geno-centric approach may be better suited to identifying the mechanisms involved. Here, we quantify the abundance of terminal genes in propionate-producing fermentative pathways in the microbiome of a large cohort of healthy subjects and patients with inflammatory bowel disease. The results show that propionate kinases responsible for propionate production in the gut are depleted in patients with Crohn's disease. Our results also indicate that changes in overall species abundances do not necessarily correlate with changes in the abundances of metabolic genes, suggesting that these genes are not part of the core genome. This, in turn, suggests that changes in strain composition may be as important as changes in species abundance in alterations of the gut microbiome associated with pathological conditions.
Keywords: Crohn’s disease; metagenomics; microbiota; short chain fatty acids.
Conflict of interest statement
The authors declare no conflict of interest. The funders had no role in the design of the study; in the collection, analyses, or interpretation of data; in the writing of the manuscript, or in the decision to publish the results.
Figures
Similar articles
-
Genetic diversity of Escherichia coli in gut microbiota of patients with Crohn's disease discovered using metagenomic and genomic analyses.BMC Genomics. 2018 Dec 27;19(1):968. doi: 10.1186/s12864-018-5306-5. BMC Genomics. 2018. PMID: 30587114 Free PMC article.
-
Anti-inflammatory Gut Microbial Pathways Are Decreased During Crohn's Disease Exacerbations.J Crohns Colitis. 2019 Oct 28;13(11):1439-1449. doi: 10.1093/ecco-jcc/jjz077. J Crohns Colitis. 2019. PMID: 31066440 Free PMC article.
-
Ectopic gut colonization: a metagenomic study of the oral and gut microbiome in Crohn's disease.Gut Pathog. 2021 Feb 25;13(1):13. doi: 10.1186/s13099-021-00409-5. Gut Pathog. 2021. PMID: 33632307 Free PMC article.
-
The gut microbiome as a target for prevention and treatment of hyperglycaemia in type 2 diabetes: from current human evidence to future possibilities.Diabetologia. 2017 Jun;60(6):943-951. doi: 10.1007/s00125-017-4278-3. Epub 2017 Apr 22. Diabetologia. 2017. PMID: 28434033 Free PMC article. Review.
-
Alteration of Gut Microbiota in Inflammatory Bowel Disease (IBD): Cause or Consequence? IBD Treatment Targeting the Gut Microbiome.Pathogens. 2019 Aug 13;8(3):126. doi: 10.3390/pathogens8030126. Pathogens. 2019. PMID: 31412603 Free PMC article. Review.
Cited by
-
Poly-omic risk scores predict inflammatory bowel disease diagnosis.mSystems. 2024 Jan 23;9(1):e0067723. doi: 10.1128/msystems.00677-23. Epub 2023 Dec 14. mSystems. 2024. PMID: 38095449 Free PMC article.
-
Imbalance of Microbacterial Diversity Is Associated with Functional Prognosis of Stroke.Neural Plast. 2023 May 8;2023:6297653. doi: 10.1155/2023/6297653. eCollection 2023. Neural Plast. 2023. PMID: 37197229 Free PMC article.
-
Quantitative Alterations in Short-Chain Fatty Acids in Inflammatory Bowel Disease: A Systematic Review and Meta-Analysis.Biomolecules. 2025 Jul 15;15(7):1017. doi: 10.3390/biom15071017. Biomolecules. 2025. PMID: 40723889 Free PMC article.
References
-
- Wlodarska M., Luo C., Kolde R., D’Hennezel E., Annand J.W., Heim C.E., Krastel P., Schmitt E.K., Omar A.S., Creasey E.A., et al. Indoleacrylic Acid Produced by Commensal Peptostreptococcus Species Suppresses Inflammation. Cell Host Microbe. 2017;22:25–37.e6. doi: 10.1016/j.chom.2017.06.007. - DOI - PMC - PubMed
