Lack of WWC2 Protein Leads to Aberrant Angiogenesis in Postnatal Mice
- PMID: 34070186
- PMCID: PMC8158494
- DOI: 10.3390/ijms22105321
Lack of WWC2 Protein Leads to Aberrant Angiogenesis in Postnatal Mice
Abstract
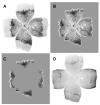
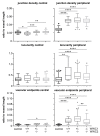
The WWC protein family is an upstream regulator of the Hippo signalling pathway that is involved in many cellular processes. We examined the effect of an endothelium-specific WWC1 and/or WWC2 knock-out on ocular angiogenesis. Knock-outs were induced in C57BL/6 mice at the age of one day (P1) and evaluated at P6 (postnatal mice) or induced at the age of five weeks and evaluated at three months of age (adult mice). We analysed morphology of retinal vasculature in retinal flat mounts. In addition, in vivo imaging and functional testing by electroretinography were performed in adult mice. Adult WWC1/2 double knock-out mice differed neither functionally nor morphologically from the control group. In contrast, the retinas of the postnatal WWC knock-out mice showed a hyperproliferative phenotype with significantly enlarged areas of sprouting angiogenesis and a higher number of tip cells. The branching and end points in the peripheral plexus were significantly increased compared to the control group. The deletion of the WWC2 gene was decisive for these effects; while knocking out WWC1 showed no significant differences. The results hint strongly that WWC2 is an essential regulator of ocular angiogenesis in mice. As an activator of the Hippo signalling pathway, it prevents excessive proliferation during physiological angiogenesis. In adult animals, WWC proteins do not seem to be important for the maintenance of the mature vascular plexus.
Keywords: Hippo signalling pathway; WWC protein; angiogenesis; endothelial cell specific knock-out; hypersprouting.
Conflict of interest statement
The authors declare no conflict of interest. The funders had no role in the design of the study; in the collection, analyses, or interpretation of data; in the writing of the manuscript, or in the decision to publish the results.
Figures


Similar articles
-
The Hippo pathway component Wwc2 is a key regulator of embryonic development and angiogenesis in mice.Cell Death Dis. 2021 Jan 22;12(1):117. doi: 10.1038/s41419-021-03409-0. Cell Death Dis. 2021. PMID: 33483469 Free PMC article.
-
WWC2 is an independent prognostic factor and prevents invasion via Hippo signalling in hepatocellular carcinoma.J Cell Mol Med. 2017 Dec;21(12):3718-3729. doi: 10.1111/jcmm.13281. Epub 2017 Aug 16. J Cell Mol Med. 2017. PMID: 28815883 Free PMC article.
-
Evolutionary and molecular facts link the WWC protein family to Hippo signaling.Mol Biol Evol. 2014 Jul;31(7):1710-23. doi: 10.1093/molbev/msu115. Epub 2014 Mar 27. Mol Biol Evol. 2014. PMID: 24682284
-
WWC Proteins: Important Regulators of Hippo Signaling in Cancer.Cancers (Basel). 2021 Jan 15;13(2):306. doi: 10.3390/cancers13020306. Cancers (Basel). 2021. PMID: 33467643 Free PMC article. Review.
-
Non-hippo kinases: indispensable roles in YAP/TAZ signaling and implications in cancer therapy.Mol Biol Rep. 2023 May;50(5):4565-4578. doi: 10.1007/s11033-023-08329-0. Epub 2023 Mar 6. Mol Biol Rep. 2023. PMID: 36877351 Review.
Cited by
-
Towards an Understanding of Retinal Diseases and Novel Treatment.Int J Mol Sci. 2022 Jul 8;23(14):7576. doi: 10.3390/ijms23147576. Int J Mol Sci. 2022. PMID: 35886925 Free PMC article.
-
Distinctive Roles of YAP and TAZ in Human Endothelial Progenitor Cells Growth and Functions.Biomedicines. 2022 Jan 11;10(1):147. doi: 10.3390/biomedicines10010147. Biomedicines. 2022. PMID: 35052826 Free PMC article.
-
WWC2 modulates GABAA-receptor-mediated synaptic transmission, revealing class-specific mechanisms of synapse regulation by WWC family proteins.Cell Rep. 2024 Oct 22;43(10):114841. doi: 10.1016/j.celrep.2024.114841. Epub 2024 Oct 10. Cell Rep. 2024. PMID: 39388350 Free PMC article.
References
MeSH terms
Substances
Grants and funding
LinkOut - more resources
Full Text Sources
Molecular Biology Databases
Research Materials

