Systematic Analysis of Long Noncoding RNA and mRNA in Granulosa Cells during the Hen Ovulatory Cycle
- PMID: 34070248
- PMCID: PMC8225051
- DOI: 10.3390/ani11061533
Systematic Analysis of Long Noncoding RNA and mRNA in Granulosa Cells during the Hen Ovulatory Cycle
Abstract
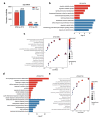
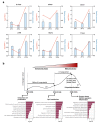
Long non-coding RNAs (lncRNAs) and mRNAs are temporally expressed during chicken follicle development. However, follicle transcriptome studies in chickens with timepoints relating to changes in luteinizing hormone (LH) levels are rare. In this study, gene expression in Rohman layers was investigated at three distinct stages of the ovulatory cycle: zeitgeber time 0 (ZT0, 9:00 a.m.), zeitgeber time 12 (ZT12, 9:00 p.m.), and zeitgeber time 20 (ZT20, 5:00 a.m.) representing the early, middle, and LH surge stages, respectively, of the ovulatory cycle. Gene expression profiles were explored during follicle development at ZT0, ZT12, and ZT20 using Ribo-Zero RNA sequencing. The three stages were separated into two major stages, including the pre-LH surge and the LH surge stages. A total of 12,479 mRNAs and 7528 lncRNAs were identified among the three stages, and 4531, 523 differentially expressed genes (DEGs) and 2367, 211 differentially expressed lncRNAs (DELs) were identified in the ZT20 vs. ZT12, and ZT12 vs. ZT0, comparisons. Functional enrichment analysis revealed that genes involved in cell proliferation and metabolism processes (lipid-related) were mainly enriched in the ZT0 and ZT12 stages, respectively, and genes related to oxidative stress, steroids regulation, and inflammatory process were enriched in the ZT20 stage. These findings provide the basis for further investigation of the specific genetic and molecular functions of follicle development in chickens.
Keywords: chicken; granulosa cell; lncRNA; luteinizing hormone surge; ovulation.
Conflict of interest statement
The authors declare no conflict of interest.
Figures


Similar articles
-
Expression and regulation of mRNA for inhibin/activin alpha- and betaA-subunits in the granulosa layer of the two largest preovulatory follicles during the hen ovulatory cycle.Gen Comp Endocrinol. 1997 Sep;107(3):386-93. doi: 10.1006/gcen.1997.6948. Gen Comp Endocrinol. 1997. PMID: 9268619
-
Variation in pituitary expression of mRNAs encoding the putative inhibin co-receptor (betaglycan) and type-I and type-II activin receptors during the chicken ovulatory cycle.J Endocrinol. 2005 Sep;186(3):447-55. doi: 10.1677/joe.1.06303. J Endocrinol. 2005. PMID: 16135664
-
Plasminogen activator production by the granulosa layer is stimulated by factor(s) produced by the theca layer and inhibited by the luteinizing hormone surge in the chicken.Biol Reprod. 1994 Apr;50(4):812-9. doi: 10.1095/biolreprod50.4.812. Biol Reprod. 1994. PMID: 8199262
-
Transcriptome Profile Analysis Reveals an Estrogen Induced LncRNA Associated with Lipid Metabolism and Carcass Traits in Chickens (Gallus Gallus).Cell Physiol Biochem. 2018;50(5):1638-1658. doi: 10.1159/000494785. Epub 2018 Nov 1. Cell Physiol Biochem. 2018. PMID: 30384372
-
Luteinizing hormone acts directly at granulosa cells to stimulate periovulatory processes: modulation of luteinizing hormone effects by prostaglandins.Endocrine. 2003 Dec;22(3):249-56. doi: 10.1385/ENDO:22:3:249. Endocrine. 2003. PMID: 14709798
Cited by
-
Proteo-transcriptomic profiles reveal key regulatory pathways and functions of LDHA in the ovulation of domestic chickens (Gallus gallus).J Anim Sci Biotechnol. 2024 May 10;15(1):68. doi: 10.1186/s40104-024-01019-2. J Anim Sci Biotechnol. 2024. PMID: 38725063 Free PMC article.
References
-
- Preisinger R., Flock D.K. Genetic Changes in Layer Breeding: Historical Trends and Future Prospects. BSAP Occas. Publ. 2000;27:20–28. doi: 10.1017/S1463981500040504. - DOI
-
- Johnson A.L. Reproduction in the Female. Sturkie’s Avian Physiol. 2015:635–665. doi: 10.1016/b978-0-12-407160-5.00028-2. - DOI
-
- Lovell T.M., Gladwell R.T., Groome N.P., Knight P.G. Ovarian Follicle Development in the Laying Hen Is Accompanied by Divergent Changes in Inhibin A, Inhibin B, Activin A and Follistatin Production in Granulosa and Theca Layers. J. Endocrinol. 2003;177:45–55. doi: 10.1677/joe.0.1770045. - DOI - PubMed
Grants and funding
- 2019B030301010/Guangdong Provincial Key Laboratory of Animal Molecular Design and Precise Breeding
- 2019KCXTD004/Innovation Team of Precise Animal Breeding
- CARS-41/Modern Agricultural Industry Technology System
- 31872347/National Natural Science Foundation of China
- SNDK-KF-201801/Open Fund of Farm Animal Genetic Resources Exploration and Innovation Key Laboratory of Sichuan Province
LinkOut - more resources
Full Text Sources
Molecular Biology Databases

