A Guide to the Generation of a 6-Hydroxydopamine Mouse Model of Parkinson's Disease for the Study of Non-Motor Symptoms
- PMID: 34070345
- PMCID: PMC8227396
- DOI: 10.3390/biomedicines9060598
A Guide to the Generation of a 6-Hydroxydopamine Mouse Model of Parkinson's Disease for the Study of Non-Motor Symptoms
Abstract
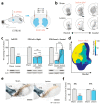
In Parkinson's disease (PD), a large number of symptoms affecting the peripheral and central nervous system precede, develop in parallel to, the cardinal motor symptoms of the disease. The study of these conditions, which are often refractory to and may even be exacerbated by standard dopamine replacement therapies, relies on the availability of appropriate animal models. Previous work in rodents showed that injection of the neurotoxin 6-hydroxydopamine (6-OHDA) in discrete brain regions reproduces several non-motor comorbidities commonly associated with PD, including cognitive deficits, depression, anxiety, as well as disruption of olfactory discrimination and circadian rhythm. However, the use of 6-OHDA is frequently associated with significant post-surgical mortality. Here, we describe the generation of a mouse model of PD based on bilateral injection of 6-OHDA in the dorsal striatum. We show that the survival rates of males and females subjected to this lesion differ significantly, with a much higher mortality among males, and provide a protocol of enhanced pre- and post-operative care, which nearly eliminates animal loss. We also briefly discuss the utility of this model for the study of non-motor comorbidities of PD.
Keywords: 6-hydroxydopamine; Parkinson’s disease; basal ganglia; behavior; bilateral; mouse; non-motor symptoms; prodromal; rodent surgery; striatum.
Conflict of interest statement
The authors declare no conflict of interest.
Figures


Similar articles
-
Alterations of the gut microbiota with antibiotics protects dopamine neuron loss and improve motor deficits in a pharmacological rodent model of Parkinson's disease.Exp Neurol. 2020 Mar;325:113159. doi: 10.1016/j.expneurol.2019.113159. Epub 2019 Dec 13. Exp Neurol. 2020. PMID: 31843492
-
A mouse model of non-motor symptoms in Parkinson's disease: focus on pharmacological interventions targeting affective dysfunctions.Front Behav Neurosci. 2014 Aug 27;8:290. doi: 10.3389/fnbeh.2014.00290. eCollection 2014. Front Behav Neurosci. 2014. PMID: 25221486 Free PMC article.
-
Probiotics Treatment Improves Hippocampal Dependent Cognition in a Rodent Model of Parkinson's Disease.Microorganisms. 2020 Oct 27;8(11):1661. doi: 10.3390/microorganisms8111661. Microorganisms. 2020. PMID: 33120961 Free PMC article.
-
Neuropsychiatric and Cognitive Deficits in Parkinson's Disease and Their Modeling in Rodents.Biomedicines. 2021 Jun 17;9(6):684. doi: 10.3390/biomedicines9060684. Biomedicines. 2021. PMID: 34204380 Free PMC article. Review.
-
Animal Model for Prodromal Parkinson's Disease.Int J Mol Sci. 2020 Mar 13;21(6):1961. doi: 10.3390/ijms21061961. Int J Mol Sci. 2020. PMID: 32183024 Free PMC article. Review.
Cited by
-
Sustained Systemic Antioxidative Effects of Intermittent Theta Burst Stimulation beyond Neurodegeneration: Implications in Therapy in 6-Hydroxydopamine Model of Parkinson's Disease.Antioxidants (Basel). 2024 Feb 8;13(2):218. doi: 10.3390/antiox13020218. Antioxidants (Basel). 2024. PMID: 38397816 Free PMC article.
-
Noninvasive Neuromodulation in Parkinson's Disease: Insights from Animal Models.J Clin Med. 2023 Aug 22;12(17):5448. doi: 10.3390/jcm12175448. J Clin Med. 2023. PMID: 37685514 Free PMC article. Review.
-
Sub-second analysis of locomotor activity in Parkinsonian mice.bioRxiv [Preprint]. 2025 Jun 18:2024.12.26.630411. doi: 10.1101/2024.12.26.630411. bioRxiv. 2025. Update in: eNeuro. 2025 Aug 5;12(8):ENEURO.0014-25.2025. doi: 10.1523/ENEURO.0014-25.2025. PMID: 39763733 Free PMC article. Updated. Preprint.
-
Impact of 6-OHDA injection and microtrauma in the rat substantia nigra on local brain amyloid beta protein concentrations in the affected area.Histol Histopathol. 2025 Apr;40(4):485-492. doi: 10.14670/HH-18-836. Epub 2024 Oct 22. Histol Histopathol. 2025. PMID: 39512105 Free PMC article.
-
Dopamine D2 receptor activation counteracts olfactory dysfunction and related cellular abnormalities in experimental parkinsonism.Heliyon. 2024 Aug 8;10(16):e35948. doi: 10.1016/j.heliyon.2024.e35948. eCollection 2024 Aug 30. Heliyon. 2024. PMID: 39224310 Free PMC article.
References
LinkOut - more resources
Full Text Sources

