. 2021 May 25;22(11):5584.
doi: 10.3390/ijms22115584.

Ubiquitin-Specific Protease 3 Deubiquitinates and Stabilizes Oct4 Protein in Human Embryonic Stem Cells

Affiliations

Ubiquitin-Specific Protease 3 Deubiquitinates and Stabilizes Oct4 Protein in Human Embryonic Stem Cells

Byung-Ho Rhie et al. Int J Mol Sci. .

Abstract

Oct4 is an important mammalian POU family transcription factor expressed by early human embryonic stem cells (hESCs). The precise level of Oct4 governs the pluripotency and fate determination of hESCs. Several post-translational modifications (PTMs) of Oct4 including phosphorylation, ubiquitination, and SUMOylation have been reported to regulate its critical functions in hESCs. Ubiquitination and deubiquitination of Oct4 should be well balanced to maintain the pluripotency of hESCs. The protein turnover of Oct4 is regulated by several E3 ligases through ubiquitin-mediated degradation. However, reversal of ubiquitination by deubiquitinating enzymes (DUBs) has not been reported for Oct4. In this study, we generated a ubiquitin-specific protease 3 (USP3) gene knockout using the CRISPR/Cas9 system and demonstrated that USP3 acts as a protein stabilizer of Oct4 by deubiquitinating Oct4. USP3 interacts with endogenous Oct4 and co-localizes in the nucleus of hESCs. The depletion of USP3 leads to a decrease in Oct4 protein level and loss of pluripotent morphology in hESCs. Thus, our results show that USP3 plays an important role in controlling optimum protein level of Oct4 to retain pluripotency of hESCs.

Keywords: 26S proteasome; CRISPR/Cas9; embryonic carcinoma cells; gene knockout; post-translational modifications.


Conflict of interest statement

The authors declare no competing interests. The funders had no role in the design of the study; in the collection, analyses, or interpretation of data; in the writing of the manuscript, or in the decision to publish the results.

Figures

Figure 1
Figure 1
Generation of USP3 knockout in NCCIT cells. (A) Schematic of RNA-guided engineered nuclease targeting of the human USP3 gene using sgRNA1 and sgRNA2, which were designed to target sequences in exon 1 and exon 3, respectively. sgRNA target sequences are represented in red, and PAM sequences in blue. (B) T7E1 assays were performed in NCCIT cells to determine the cleavage efficiency of sgRNA1 and sgRNA2 by transfecting along with Cas9 plasmid. Samples were resolved in 2% agarose gel. The cleaved band intensity obtained from T7E1 assay were measured (indel %) using ImageJ software. Un-transfected NCCIT cells were used as control cells. A marker is shown for size reference. (C) USP3 knockout single-cell colonies were screened using the T7E1 assay (upper panel). The USP3 KO-positive clones, i.e., USP3 KO#2 and #3 were reconfirmed by T7E1 assay (lower panel). (D) USP3 gene-disrupted sequences obtained from Sanger sequencing, i.e., USP3 KO#2 (upper panel) and USP3 KO#3 (lower panel). The sgRNA recognition site is indicated in red, and the protospacer adjacent motif (PAM) is indicated in blue. Dashes indicate deleted bases, while inserted bases are represented in black. The number of deleted and inserted bases are mentioned in the parentheses; the numbers of occurrences of the indicated sequences are shown in parentheses (for example, X1 and X2 indicate the number of each clone sequenced). (E) USP3 knockout efficiency in NCCIT cells was checked by Western blot analysis for USP3 KO clones #2 and #3 using the USP3-specific antibody. GAPDH was used as loading control.
Figure 2
Figure 2
USP3 regulated Oct4 protein stability. (A) Protein expression of stem cell transcription factors upon deletion of USP3 in USP3 KO NCCIT clones #2 and #3 were detected by Western blot analysis using the indicated antibodies. GAPDH was used as a loading control. (B) NCCIT cells were transfected with constant amount of Cas9 along with increasing concentrations of sgRNA targeting USP3 (1:1 and 1:3 ratios, respectively). Depletion of USP3 and its effect on the endogenous expression of Oct4 protein was detected by Western blot. The band intensities of Oct4 proteins were estimated using ImageJ software and were graphically represented after normalization with GAPDH. Data were presented as the means ± SDs of three independent experiments (n = 3). Statistical analysis was conducted by Student’s t-test (** p < 0.01, *** p < 0.001). (C) NCCIT cells were transfected with increasing concentrations of wild-type Flag-USP3 (0, 2, 4 μg), and the endogenous expression of Oct4 was analyzed by Western blotting. The band intensity of Oct4 proteins were estimated using ImageJ software and graphically represented after normalization with GAPDH. Data were presented as the means ± SDs of three independent experiments (n = 3). Statistical analysis was conducted by Student’s t-test (** p < 0.01). (D) NCCIT cells were transfected with increasing concentrations of catalytic mutant Flag-USP3CS (0, 2, 4 μg), and the endogenous expression of Oct4 was analyzed by Western blotting. The band intensities of Oct4 proteins were estimated using ImageJ software and graphically represented after normalization with GAPDH. Data were presented as the means ± SDs of three independent experiments (n = 3). Statistical analysis was conducted by Student’s t-test (ns = not significant). (E) HEK293 cells were transfected with a constant amount of Myc-Oct4 (1 μg) along with increasing concentrations of Flag-USP3 (0, 1, 2, 3 μg), and the exogenous expression of Myc-Oct4 was analyzed by Western blotting. (F) HEK293 cells were transfected with a constant amount of Myc-Oct4 (1 μg) along with increasing concentrations of Flag-USP3CS (0, 1, 2, 3 μg), and the exogenous expression of Myc-Oct4 was analyzed by Western blotting. (G,H) The half-life of Oct4 was measured in USP3-expressing NCCIT cells, USP3-deleted NCCIT cells, and USP3-deleted NCCIT cells transfected with (G) Flag-USP3 or (H) Flag-USP3CS upon the treatment of 150 μg/mL protein synthesis inhibitor cycloheximide (CHX). Cells were harvested at different time points (0, 2, and 4 h) and analyzed by Western blotting.
Figure 3
Figure 3
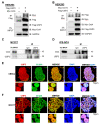
USP3 interacted and co-localized with Oct4. Exogenous immunoprecipitation (IP) was performed by co-transfecting Flag-USP3 and Myc-Oct4 into HEK293 cells. (A) IP was performed using anti-Flag antibody and immunoblotted using anti-Myc antibody. GAPDH was used as a loading control. (B) IP was performed using anti-Myc antibody, immunoblotted using anti-Flag antibody. GAPDH was used as a loading control. (C) Endogenous interaction between USP3 and Oct4 was demonstrated in NCCIT cells by performing IP using anti-USP3 antibody and immunoblotted with anti-Oct4 antibody. GAPDH was used as a loading control. (D) Endogenous interaction between USP3 and Oct4 in human iPSCs was demonstrated by performing IP with anti-USP3 antibody and immunoblotted with anti-Oct4 antibody. GAPDH was used as a loading control. (E) Co-localization analysis between endogenous USP3 and Oct4 was performed in hESCs by immunostaining with anti-USP3 and Oct4-specific antibodies. DAPI was used to stain the nucleus. (Scale bar: 50 μm). Inset represents threefold magnified images. (F) Co-localization analysis between endogenous USP3 and Oct4 was performed in NCCIT by immunostaining with anti-USP3 and Oct4-specific antibodies. DAPI was used to stain the nucleus. (scale bar: 50 μm). Inset represents threefold magnified images.
Figure 4
Figure 4
Deubiquitination of Oct4 by USP3. (A) The effect of USP3 gene knockout on the mRNA expression of Oct4 was analyzed by qRT-PCR analysis with specific primers. Representation of relative mRNA expression levels of Oct4 after normalization with GAPDH. (B) USP3-expressing and USP3-depleted NCCIT cells were treated with the proteasome inhibitor MG132 (DMSO as control, 2.5, 5, or 10 μM MG132) for 6 h at the indicated concentrations and analyzed by immunoblotting against the indicated antibodies. GAPDH was used as a loading control. (C) For endogenous Oct4 deubiquitination assay in NCCIT, Flag-USP3, Flag-USP3CS, and sgRNA targeting USP3 were transfected into NCCIT cells as indicated. Oct4 deubiquitination was confirmed by IP with Oct4-specific antibody and immunoblotted with the ubiquitin-specific antibody. (D) For endogenous Oct4 deubiquitination assay in hESCs, Flag-USP3 and USP3-targeting sgRNA were transfected into hESCs as indicated. Oct4 deubiquitination was confirmed by IP with Oct4-specific antibody and immunoblotted with ubiquitin-specific antibody. (E) Tandem ubiquitin binding entities (TUBEs) assay for the ubiquitination of Oct4 proteins were performed in USP3-expressing and USP3-depleted NCCIT cells treated with 10 μM MG132 for 6 h. Cell lysates were immunoprecipitated with agarose–TUBE beads and immunoblotted with Oct4-specific antibodies.
Figure 5
Figure 5
Loss of USP3 affected hESCs morphology and colony numbers. (A) hESCs were subjected to embryoid body (EB) differentiation for 5 days by dissociation of hESC clumps using collagenase IV and culturing the aggregates using Essential 6TM Media. (B) Western blot analysis of differentiating EBs (days 1–5) was performed using the indicated antibodies. D1-D5 indicate the number of days of EB culture, and cells were collected at the indicated time points for Western blot analysis (C) hESCs were transfected with plasmids encoding USP3 targeting sgRNA and Cas9. The expression of USP3 and Oct4 was analyzed from the pooled transfected cell population by Western blot. The band intensity of Oct4 proteins were estimated using ImageJ software and graphically represented after normalization with GAPDH. Data were presented as the means ± SDs of three independent experiments (n = 3). Statistical analysis was conducted by Student’s t-test (** p < 0.01). (D) hESCs transfected with plasmids encoding USP3 targeting sgRNA and Cas9 were reseeded into 96-well plates and cultured for 20 days. Single round colonies were marked and analyzed by T7E1 assay. Arrowheads indicate the expected positions of DNA bands cleaved by T7E1. Mock-transfected hESCs served as control. Only T7E1-positive USP3 KO hES clones were loaded on the gel (clones #2, #5, and #9). (E) The morphology of mock hESCs and T7E1-positive USP3 KO hESCs (hESCs USP3 KO) under bright field microscopy. Representative image of three different USP3 KO clones. (F) The graph represents average number of colonies obtained from mock hESCs and USP3 KO clones. Data are represented as the mean and standard deviation of three different USP3KO clones. Statistical analysis was performed using unpaired two-tailed Student’s t-test: ** p < 0.01. (G) Alkaline phosphatase (AP) staining of mock hESCs and USP3 KO clones. The image is a representative image of three independent experiments. (H) The graphical representation of the mean percentage of AP-positive and AP-negative colonies for mock hESCs and USP3 KO clones. Statistical analysis was performed using unpaired two-tailed Student’s t-test: *** p < 0.001; n = 3. (I) Immunofluorescence analysis of mock hESCs and USP3 KO clones for the expression of USP3, Tra-1-60, and SSEA-4. Representative image of three different USP3KO clones. Inset images represent DAPI (blue)-stained nucleus.

Similar articles

Cited by

References

    1. Boyer L.A., Lee T.I., Cole M.F., Johnstone S.E., Levine S.S., Zucker J.P., Guenther M.G., Kumar R.M., Murray H.L., Jenner R.G., et al. Core transcriptional regulatory circuitry in human embryonic stem cells. Cell. 2005;122:947–956. doi: 10.1016/j.cell.2005.08.020. - DOI - PMC - PubMed
    1. Buckley S.M., Aranda-Orgilles B., Strikoudis A., Apostolou E., Loizou E., Moran-Crusio K., Farnsworth C.L., Koller A.A., Dasgupta R., Silva J.C., et al. Regulation of pluripotency and cellular reprogramming by the ubiquitin-proteasome system. Cell Stem Cell. 2012;11:783–798. doi: 10.1016/j.stem.2012.09.011. - DOI - PMC - PubMed
    1. Okita Y., Nakayama K.I. UPS delivers pluripotency. Cell Stem Cell. 2012;11:728–730. doi: 10.1016/j.stem.2012.11.009. - DOI - PubMed
    1. Tatetsu H., Kong N.R., Chong G., Amabile G., Tenen D.G., Chai L. SALL4, the missing link between stem cells, development and cancer. Gene. 2016;584:111–119. doi: 10.1016/j.gene.2016.02.019. - DOI - PMC - PubMed
    1. Chambers I., Colby D., Robertson M., Nichols J., Lee S., Tweedie S., Smith A. Functional expression cloning of Nanog, a pluripotency sustaining factor in embryonic stem cells. Cell. 2003;113:643–655. doi: 10.1016/S0092-8674(03)00392-1. - DOI - PubMed

MeSH terms

Substances