

Preferent Diaphragmatic Involvement in TK2 Deficiency: An Autopsy Case Study
- PMID: 34070501
- PMCID: PMC8199166
- DOI: 10.3390/ijms22115598
Preferent Diaphragmatic Involvement in TK2 Deficiency: An Autopsy Case Study
Abstract
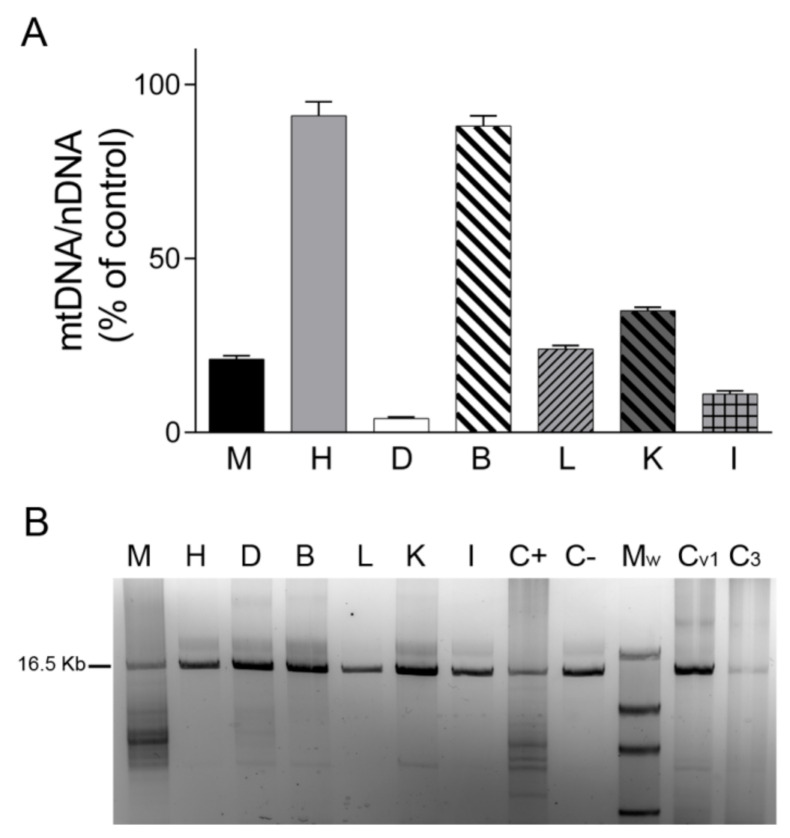
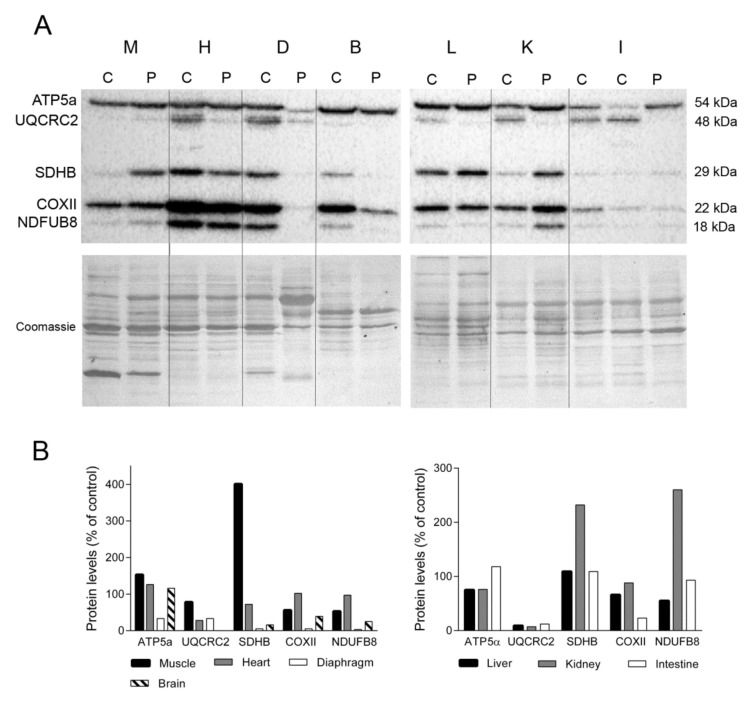
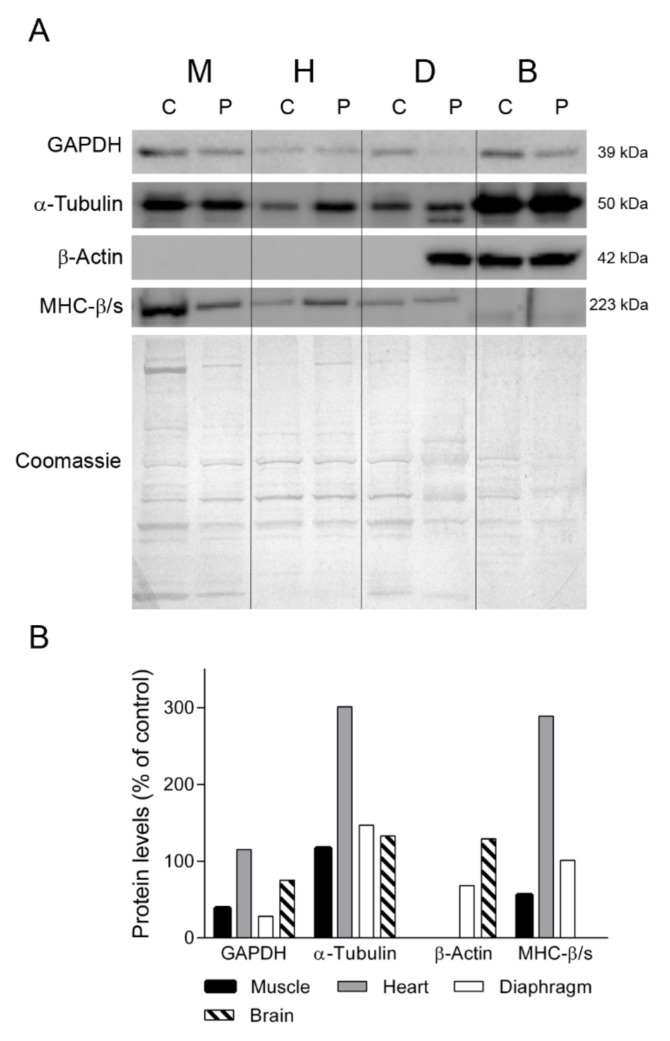
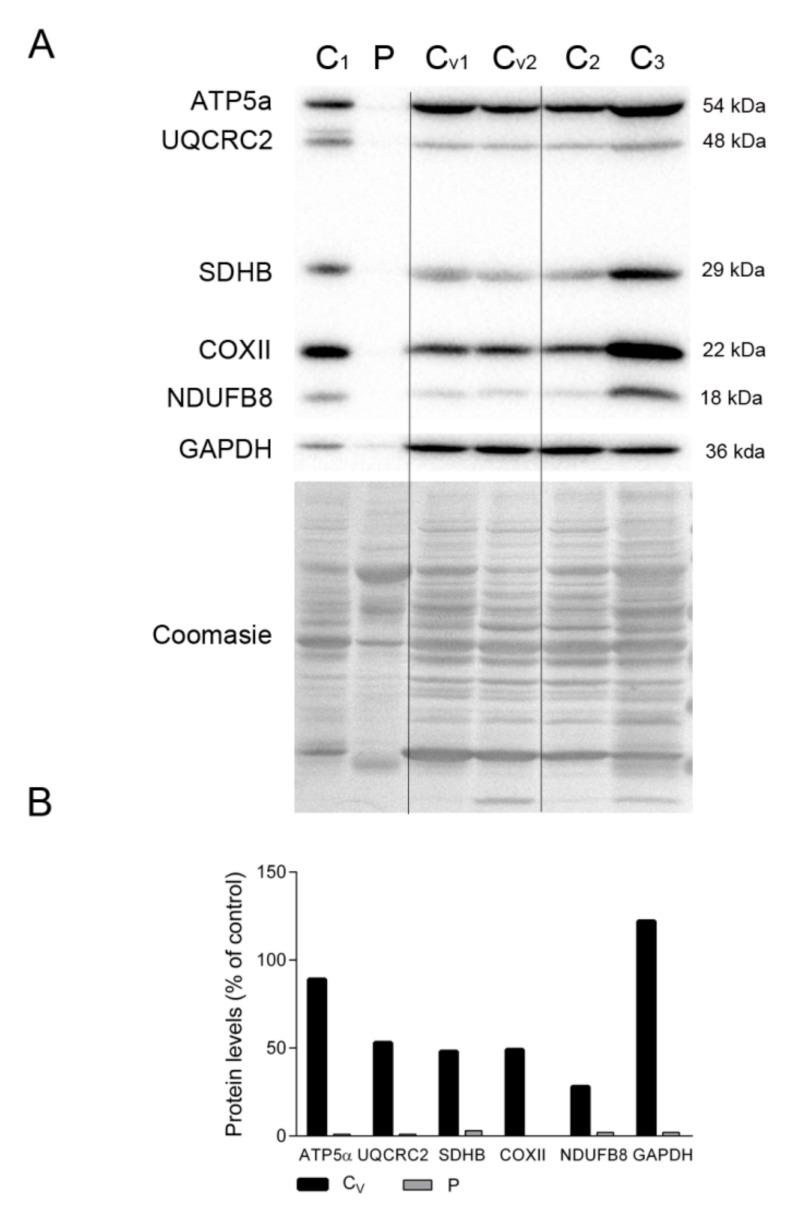
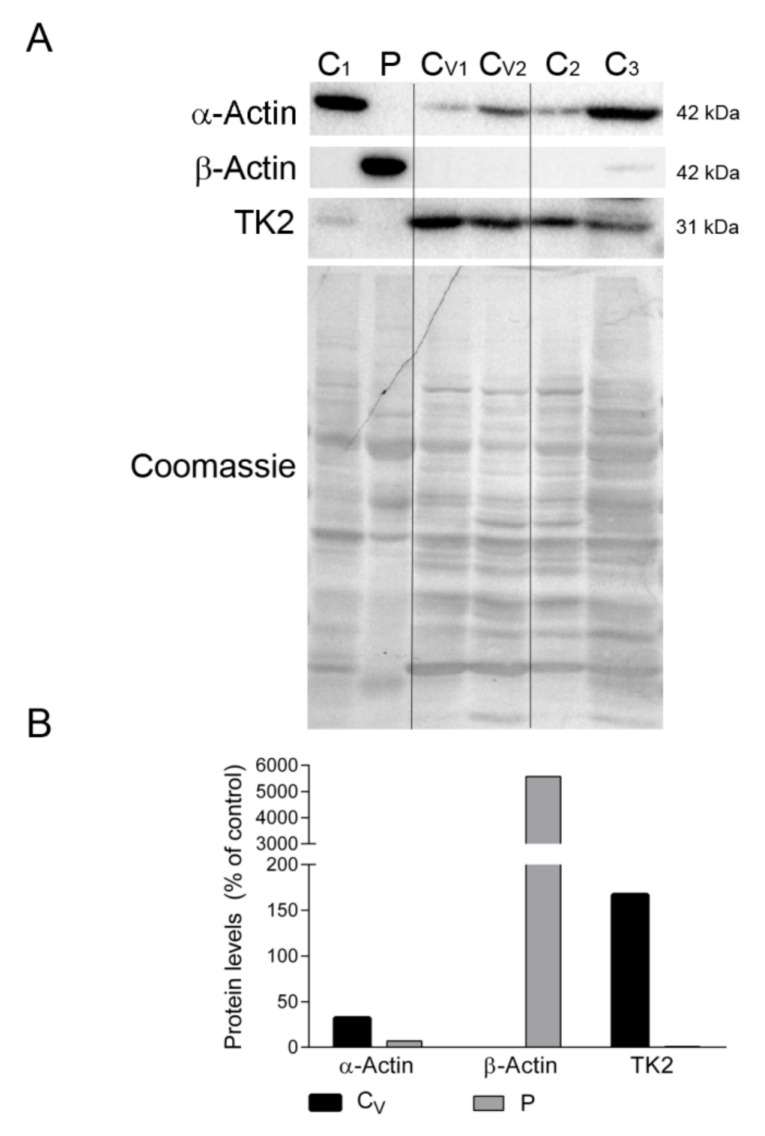
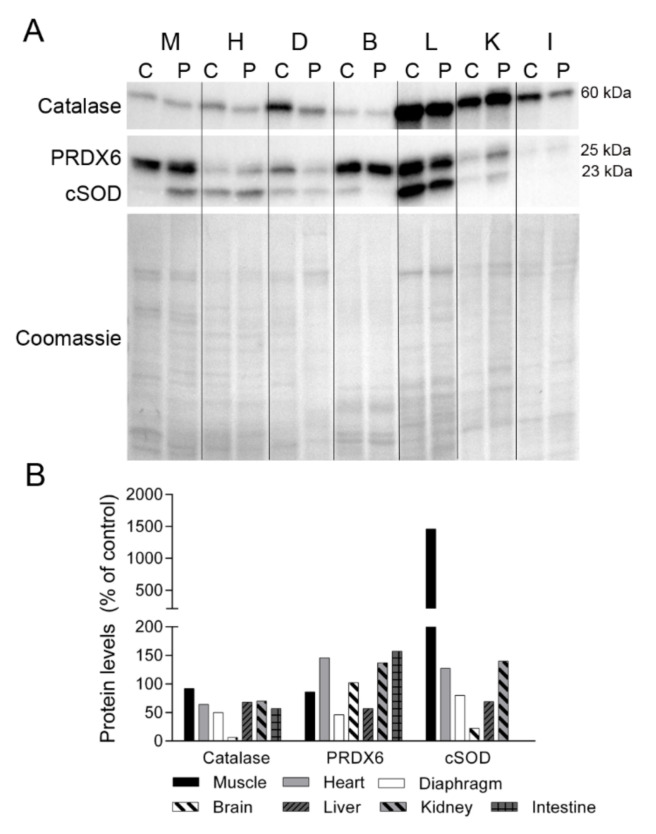
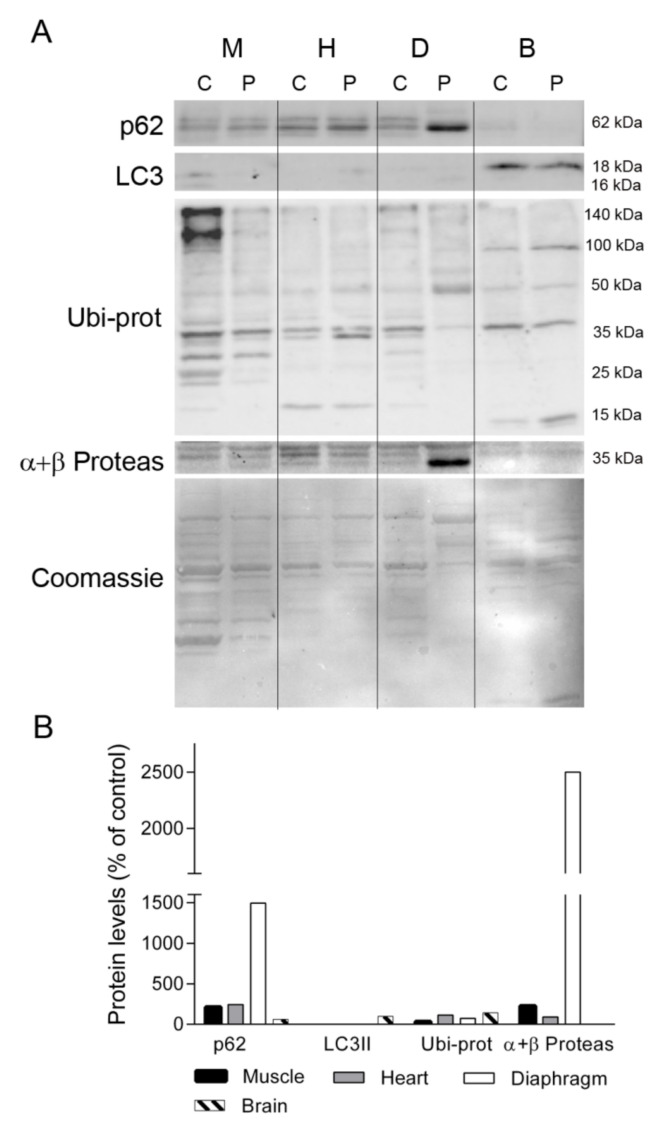
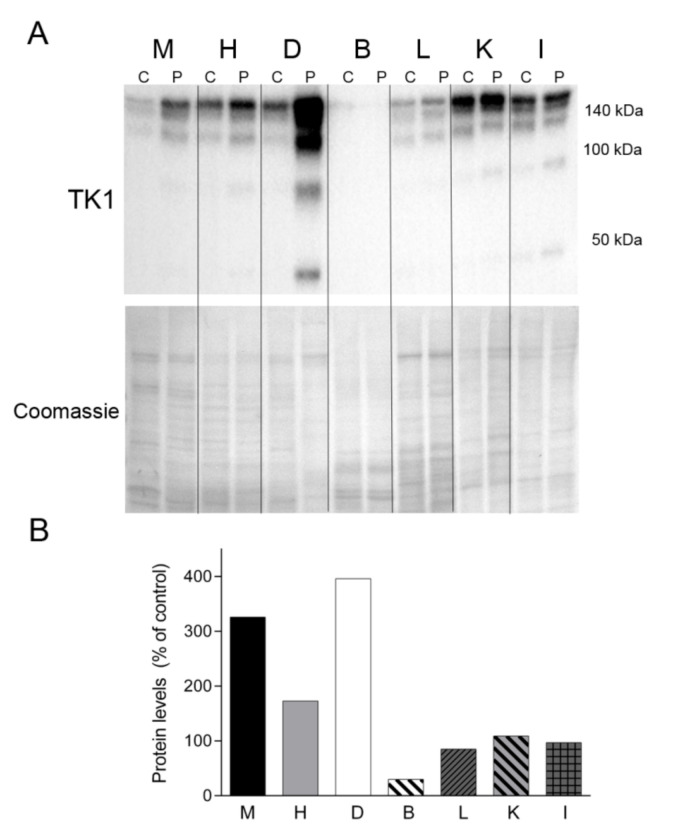
Our goal was to analyze postmortem tissues of an adult patient with late-onset thymidine kinase 2 (TK2) deficiency who died of respiratory failure. Compared with control tissues, we found a low mtDNA content in the patient's skeletal muscle, liver, kidney, small intestine, and particularly in the diaphragm, whereas heart and brain tissue showed normal mtDNA levels. mtDNA deletions were present in skeletal muscle and diaphragm. All tissues showed a low content of OXPHOS subunits, and this was especially evident in diaphragm, which also exhibited an abnormal protein profile, expression of non-muscular β-actin and loss of GAPDH and α-actin. MALDI-TOF/TOF mass spectrometry analysis demonstrated the loss of the enzyme fructose-bisphosphate aldolase, and enrichment for serum albumin in the patient's diaphragm tissue. The TK2-deficient patient's diaphragm showed a more profound loss of OXPHOS proteins, with lower levels of catalase, peroxiredoxin 6, cytosolic superoxide dismutase, p62 and the catalytic subunits of proteasome than diaphragms of ventilated controls. Strong overexpression of TK1 was observed in all tissues of the patient with diaphragm showing the highest levels. TK2 deficiency induces a more profound dysfunction of the diaphragm than of other tissues, which manifests as loss of OXPHOS and glycolytic proteins, sarcomeric components, antioxidants and overactivation of the TK1 salvage pathway that is not attributed to mechanical ventilation.
Keywords: diaphragm; mitochondrial diseases; respiratory failure; thymidine kinase 2.
Conflict of interest statement
The authors declare no conflict of interest. The funders had no role in the design of the study; in the collection, analyses, or interpretation of data; in the writing of the manuscript, or in the decision to publish the results.
Figures
Similar articles
-
Bioavailability and cytosolic kinases modulate response to deoxynucleoside therapy in TK2 deficiency.EBioMedicine. 2019 Aug;46:356-367. doi: 10.1016/j.ebiom.2019.07.037. Epub 2019 Aug 2. EBioMedicine. 2019. PMID: 31383553 Free PMC article.
-
Basic biochemical characterization of cytosolic enzymes in thymidine nucleotide synthesis in adult rat tissues: implications for tissue specific mitochondrial DNA depletion and deoxynucleoside-based therapy for TK2-deficiency.BMC Mol Cell Biol. 2020 Apr 28;21(1):33. doi: 10.1186/s12860-020-00272-3. BMC Mol Cell Biol. 2020. PMID: 32345222 Free PMC article.
-
Age-related metabolic changes limit efficacy of deoxynucleoside-based therapy in thymidine kinase 2-deficient mice.EBioMedicine. 2019 Aug;46:342-355. doi: 10.1016/j.ebiom.2019.07.042. Epub 2019 Jul 24. EBioMedicine. 2019. PMID: 31351931 Free PMC article.
-
Deoxyribonucleoside kinases in mitochondrial DNA depletion.Nucleosides Nucleotides Nucleic Acids. 2004 Oct;23(8-9):1205-15. doi: 10.1081/NCN-200027480. Nucleosides Nucleotides Nucleic Acids. 2004. PMID: 15571232 Review.
-
Thymidine kinase 2 enzyme kinetics elucidate the mechanism of thymidine-induced mitochondrial DNA depletion.Biochemistry. 2014 Oct 7;53(39):6142-50. doi: 10.1021/bi5006877. Epub 2014 Sep 23. Biochemistry. 2014. PMID: 25215937 Review.
Cited by
-
Mitochondrial DNA-targeted therapy: A novel approach to combat cancer.Cell Insight. 2023 Jul 22;2(4):100113. doi: 10.1016/j.cellin.2023.100113. eCollection 2023 Aug. Cell Insight. 2023. PMID: 37554301 Free PMC article. Review.
-
Collaborative model for diagnosis and treatment of very rare diseases: experience in Spain with thymidine kinase 2 deficiency.Orphanet J Rare Dis. 2021 Oct 2;16(1):407. doi: 10.1186/s13023-021-02030-w. Orphanet J Rare Dis. 2021. PMID: 34600563 Free PMC article. Review.
-
Clinical and Genetic Analysis of Patients With TK2 Deficiency.Neurol Genet. 2024 Mar 25;10(2):e200138. doi: 10.1212/NXG.0000000000200138. eCollection 2024 Apr. Neurol Genet. 2024. PMID: 38544965 Free PMC article.
-
Clinical and molecular spectrum of TK2-deficiency: a large Brazilian cohort.Sci Rep. 2025 Mar 15;15(1):9013. doi: 10.1038/s41598-024-84373-5. Sci Rep. 2025. PMID: 40089535 Free PMC article.
-
Novel biallelic TK2 mutations cause mitochondrial DNA depletion syndrome with infantile early-onset lipid storage myopathy.Orphanet J Rare Dis. 2025 Mar 17;20(1):130. doi: 10.1186/s13023-025-03639-x. Orphanet J Rare Dis. 2025. PMID: 40098049 Free PMC article.
References
-
- Domínguez-González C., Hernández-Laín A., Rivas E., Hernández-Voth A., Sayas Catalán J., Fernández-Torrón R., Fuiza-Luces C., García García J., Morís G., Olivé M., et al. Late-onset thymidine kinase 2 deficiency: A review of 18 cases. Orphanet J. Rare Dis. 2019;14:1–10. doi: 10.1186/s13023-019-1071-z. - DOI - PMC - PubMed
Publication types
MeSH terms
Substances
Grants and funding
LinkOut - more resources
Full Text Sources
Medical
Research Materials
