

Self-Targeting of Carbon Dots into the Cell Nucleus: Diverse Mechanisms of Toxicity in NIH/3T3 and L929 Cells
- PMID: 34070594
- PMCID: PMC8198156
- DOI: 10.3390/ijms22115608
Self-Targeting of Carbon Dots into the Cell Nucleus: Diverse Mechanisms of Toxicity in NIH/3T3 and L929 Cells
Abstract
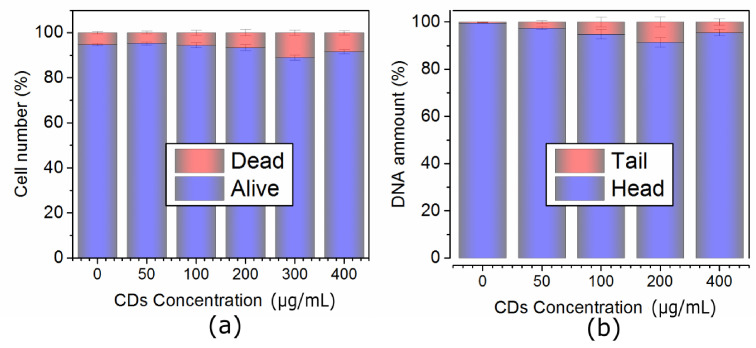
It is important to understand the nanomaterials intracellular trafficking and distribution and investigate their targeting into the nuclear area in the living cells. In our previous study, we firstly observed penetration of nonmodified positively charged carbon dots decorated with quaternary ammonium groups (QCDs) into the nucleus of mouse NIH/3T3 fibroblasts. Thus, in this work, we focused on deeper study of QCDs distribution inside two healthy mouse NIH/3T3 and L929 cell lines by fluorescence microspectroscopy and performed a comprehensive cytotoxic and DNA damage measurements. Real-time penetration of QCDs across the plasma cell membrane was recorded, concentration dependent uptake was determined and endocytic pathways were characterized. We found out that the QCDs concentration of 200 µg/mL is close to saturation and subsequently, NIH/3T3 had a different cell cycle profile, however, no significant changes in viability (not even in the case with QCDs in the nuclei) and DNA damage. In the case of L929, the presence of QCDs in the nucleus evoked a cellular death. Intranuclear environment of NIH/3T3 cells affected fluorescent properties of QCDs and evoked fluorescence blue shifts. Studying the intracellular interactions with CDs is essential for development of future applications such as DNA sensing, because CDs as DNA probes have not yet been developed.
Keywords: L929; NIH/3T3; carbon dots; cnucleus; cytotoxicity; fibroblasts; fluorescence microspectroscopy; genotoxicity; nucleolus.
Conflict of interest statement
The funders had no role in the design of the study; in the collection, analyses, or interpretation of data; in the writing of the manuscript, or in the decision to publish the results.
Figures


Similar articles
-
Intracellular Trafficking of Cationic Carbon Dots in Cancer Cell Lines MCF-7 and HeLa-Time Lapse Microscopy, Concentration-Dependent Uptake, Viability, DNA Damage, and Cell Cycle Profile.Int J Mol Sci. 2022 Jan 19;23(3):1077. doi: 10.3390/ijms23031077. Int J Mol Sci. 2022. PMID: 35162996 Free PMC article.
-
Quaternized carbon dot-modified graphene oxide for selective cell labelling--controlled nucleus and cytoplasm imaging.Chem Commun (Camb). 2014 Sep 25;50(74):10782-5. doi: 10.1039/c4cc02637c. Chem Commun (Camb). 2014. PMID: 24983507
-
Parallel comparative studies on the toxic effects of unmodified CdTe quantum dots, gold nanoparticles, and carbon nanodots on live cells as well as green gram sprouts.Talanta. 2013 Nov 15;116:237-44. doi: 10.1016/j.talanta.2013.05.022. Epub 2013 May 16. Talanta. 2013. PMID: 24148399
-
Carbon dots with pH-responsive fluorescence: a review on synthesis and cell biological applications.Mikrochim Acta. 2020 Jan 27;187(2):150. doi: 10.1007/s00604-019-4091-4. Mikrochim Acta. 2020. PMID: 31989317 Review.
-
Review on carbon dots in food safety applications.Talanta. 2019 Mar 1;194:809-821. doi: 10.1016/j.talanta.2018.11.005. Epub 2018 Nov 6. Talanta. 2019. PMID: 30609610 Review.
Cited by
-
Quantum Dots and Their Interaction with Biological Systems.Int J Mol Sci. 2022 Sep 15;23(18):10763. doi: 10.3390/ijms231810763. Int J Mol Sci. 2022. PMID: 36142693 Free PMC article. Review.
-
Multiplexed bio-imaging using cadmium telluride quantum dots synthesized by mathematically derived process parameters in a continuous flow active microreactor.Mater Today Bio. 2021 Jul 24;11:100123. doi: 10.1016/j.mtbio.2021.100123. eCollection 2021 Jun. Mater Today Bio. 2021. PMID: 34458715 Free PMC article.
-
Milk-Derived Carbon Quantum Dots: Study of Biological and Chemical Properties Provides Evidence of Toxicity.Molecules. 2022 Dec 9;27(24):8728. doi: 10.3390/molecules27248728. Molecules. 2022. PMID: 36557861 Free PMC article.
-
Nanostructured N/S doped carbon dots/mesoporous silica nanoparticles and PVA composite hydrogel fabrication for anti-microbial and anti-biofilm application.Int J Pharm X. 2023 Sep 1;6:100209. doi: 10.1016/j.ijpx.2023.100209. eCollection 2023 Dec 15. Int J Pharm X. 2023. PMID: 37711848 Free PMC article.
-
Cytotoxicity of Carbon Nanotubes, Graphene, Fullerenes, and Dots.Nanomaterials (Basel). 2023 Apr 25;13(9):1458. doi: 10.3390/nano13091458. Nanomaterials (Basel). 2023. PMID: 37177003 Free PMC article. Review.
References
-
- Liu H., Bai Y., Zhou Y., Feng C., Liu L., Fang L., Liang J., Xiao S. Blue and cyan fluorescent carbon dots: One-pot synthesis, selective cell imaging and their antiviral activity. RSC Adv. 2017;7:28016–28023. doi: 10.1039/C7RA03167J. - DOI
-
- Wang Y., Hu A. Carbon quantum dots: Synthesis, properties and applications. J. Mater. Chem. C. 2014;2:6921–6939. doi: 10.1039/C4TC00988F. - DOI
-
- Hu Y., Yang J., Jia L., Yu J.S. Ethanol in aqueous hydrogen peroxide solution: Hydrothermal synthesis of highly photoluminescent carbon dots as multifunctional nanosensors. Carbon. 2015;93:999–1007. doi: 10.1016/j.carbon.2015.06.018. - DOI
MeSH terms
Substances
LinkOut - more resources
Full Text Sources
