

Effects of FGFR Tyrosine Kinase Inhibition in OLN-93 Oligodendrocytes
- PMID: 34070622
- PMCID: PMC8228431
- DOI: 10.3390/cells10061318
Effects of FGFR Tyrosine Kinase Inhibition in OLN-93 Oligodendrocytes
Abstract
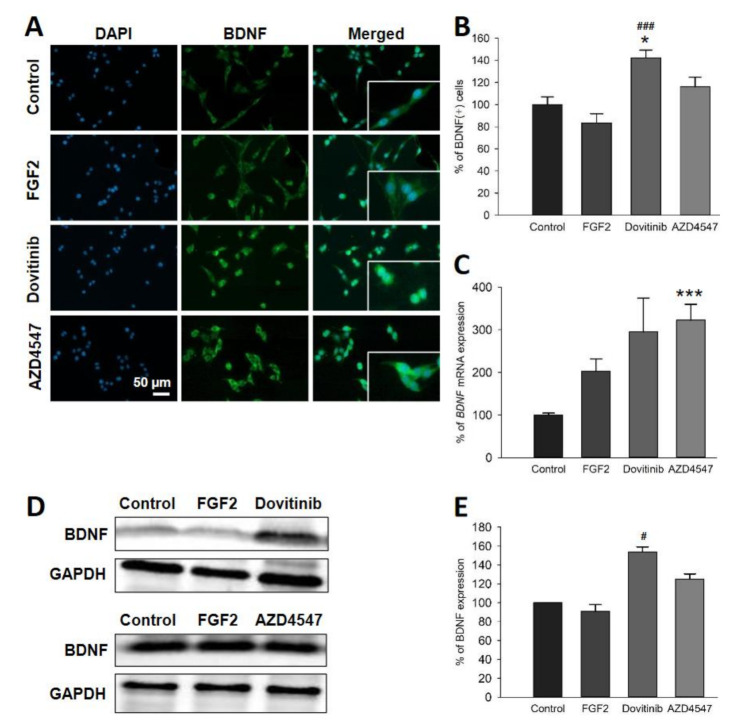
Fibroblast growth factor (FGF) signaling is involved in the pathogenesis of multiple sclerosis (MS). Data from neuropathology studies suggest that FGF signaling contributes to the failure of remyelination in MS. In MOG35-55-induced EAE, oligodendrocyte-specific deletion of FGFR1 and FGFR2 resulted in a less severe disease course, reduced inflammation, myelin and axon degeneration and changed FGF/FGFR and BDNF/TrkB signaling. Since signaling cascades in oligodendrocytes could not be investigated in the EAE studies, we here aimed to characterize FGFR-dependent oligodendrocyte-specific signaling in vitro. FGFR inhibition was achieved by application of the multi-kinase-inhibitor dovitinib and the FGFR1/2/3-inhibitor AZD4547. Both substances are potent inhibitors of FGF signaling; they are effective in experimental tumor models and patients with malignancies. Effects of FGFR inhibition in oligodendrocytes were studied by immunofluorescence microscopy, protein and gene analyses. Application of the tyrosine kinase inhibitors reduced FGFR1, phosphorylated ERK and Akt expression, and it enhanced BDNF and TrkB expression. Furthermore, the myelin proteins CNPase and PLP were upregulated by FGFR inhibition. In summary, inhibition of FGFR signaling in oligodendrocytes can be achieved by application of tyrosine kinase inhibitors. Decreased phosphorylation of ERK and Akt is associated with an upregulation of BDNF/TrkB signaling, which may be responsible for the increased production of myelin proteins. Furthermore, these data suggest that application of FGFR inhibitors may have the potential to promote remyelination in the CNS.
Keywords: AZD4547; FGFR signaling; dovitinib; multiple sclerosis; myelin; oligodendrocytes.
Conflict of interest statement
The authors declare no conflict of interest.
Figures


Similar articles
-
Oligodendrocyte-Specific Deletion of FGFR1 Reduces Cerebellar Inflammation and Neurodegeneration in MOG35-55-Induced EAE.Int J Mol Sci. 2021 Aug 31;22(17):9495. doi: 10.3390/ijms22179495. Int J Mol Sci. 2021. PMID: 34502405 Free PMC article.
-
Combination treatment of prostate cancer with FGF receptor and AKT kinase inhibitors.Oncotarget. 2017 Jan 24;8(4):6179-6192. doi: 10.18632/oncotarget.14049. Oncotarget. 2017. PMID: 28008155 Free PMC article.
-
Oligodendrocyte-specific deletion of FGFR2 ameliorates MOG35-55 -induced EAE through ERK and Akt signalling.Brain Pathol. 2021 Mar;31(2):297-311. doi: 10.1111/bpa.12916. Epub 2021 Jan 4. Brain Pathol. 2021. PMID: 33103299 Free PMC article.
-
FGF/FGFR Pathways in Multiple Sclerosis and in Its Disease Models.Cells. 2021 Apr 13;10(4):884. doi: 10.3390/cells10040884. Cells. 2021. PMID: 33924474 Free PMC article. Review.
-
FGFR inhibitors: Effects on cancer cells, tumor microenvironment and whole-body homeostasis (Review).Int J Mol Med. 2016 Jul;38(1):3-15. doi: 10.3892/ijmm.2016.2620. Epub 2016 May 31. Int J Mol Med. 2016. PMID: 27245147 Free PMC article. Review.
Cited by
-
Cumulative Roles for Epstein-Barr Virus, Human Endogenous Retroviruses, and Human Herpes Virus-6 in Driving an Inflammatory Cascade Underlying MS Pathogenesis.Front Immunol. 2021 Nov 1;12:757302. doi: 10.3389/fimmu.2021.757302. eCollection 2021. Front Immunol. 2021. PMID: 34790199 Free PMC article.
-
Oligodendrocyte-Specific Deletion of FGFR1 Reduces Cerebellar Inflammation and Neurodegeneration in MOG35-55-Induced EAE.Int J Mol Sci. 2021 Aug 31;22(17):9495. doi: 10.3390/ijms22179495. Int J Mol Sci. 2021. PMID: 34502405 Free PMC article.
-
FGF/FGFR system in the central nervous system demyelinating disease: Recent progress and implications for multiple sclerosis.CNS Neurosci Ther. 2023 Jun;29(6):1497-1511. doi: 10.1111/cns.14176. Epub 2023 Mar 16. CNS Neurosci Ther. 2023. PMID: 36924298 Free PMC article. Review.
-
Interferon Beta-1a versus Combined Interferon Beta-1a and Oligodendrocyte-Specific FGFR1 Deletion in Experimental Autoimmune Encephalomyelitis.Int J Mol Sci. 2022 Oct 12;23(20):12183. doi: 10.3390/ijms232012183. Int J Mol Sci. 2022. PMID: 36293040 Free PMC article.
-
Roles of the FGF-FGFR Signaling System in Cancer Development and Inflammation.Cells. 2021 Aug 28;10(9):2231. doi: 10.3390/cells10092231. Cells. 2021. PMID: 34571880 Free PMC article.
References
Publication types
MeSH terms
Substances
LinkOut - more resources
Full Text Sources
Medical
Research Materials
Miscellaneous
