

The Effect of Metformin in Diabetic and Non-Diabetic Rats with Experimentally-Induced Chronic Kidney Disease
- PMID: 34070807
- PMCID: PMC8227500
- DOI: 10.3390/biom11060814
The Effect of Metformin in Diabetic and Non-Diabetic Rats with Experimentally-Induced Chronic Kidney Disease
Abstract
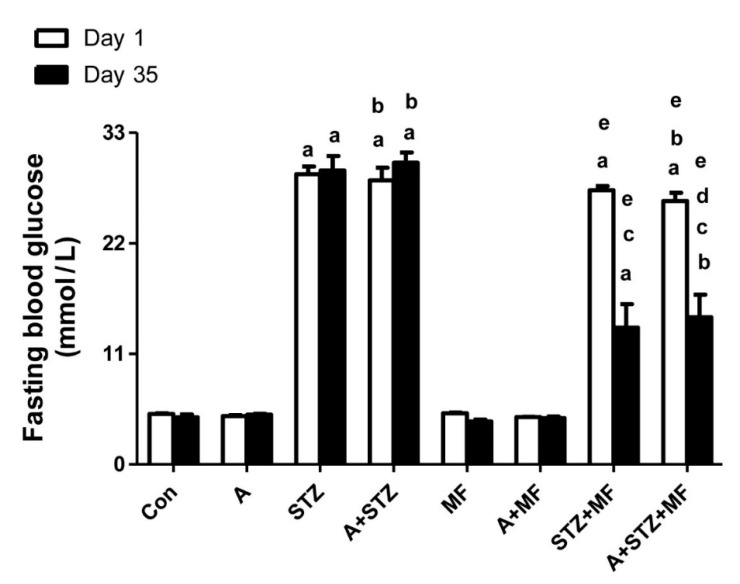
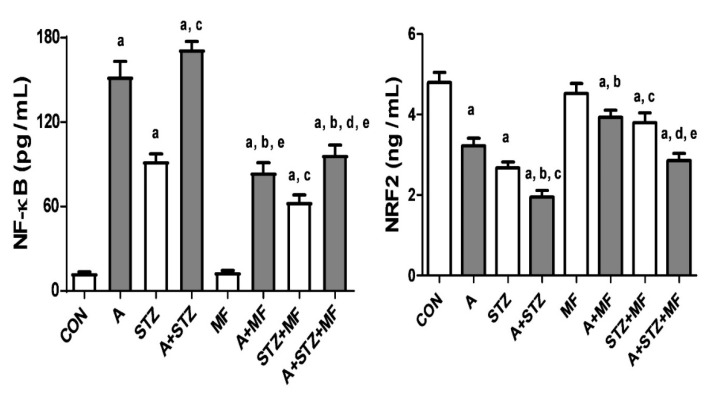
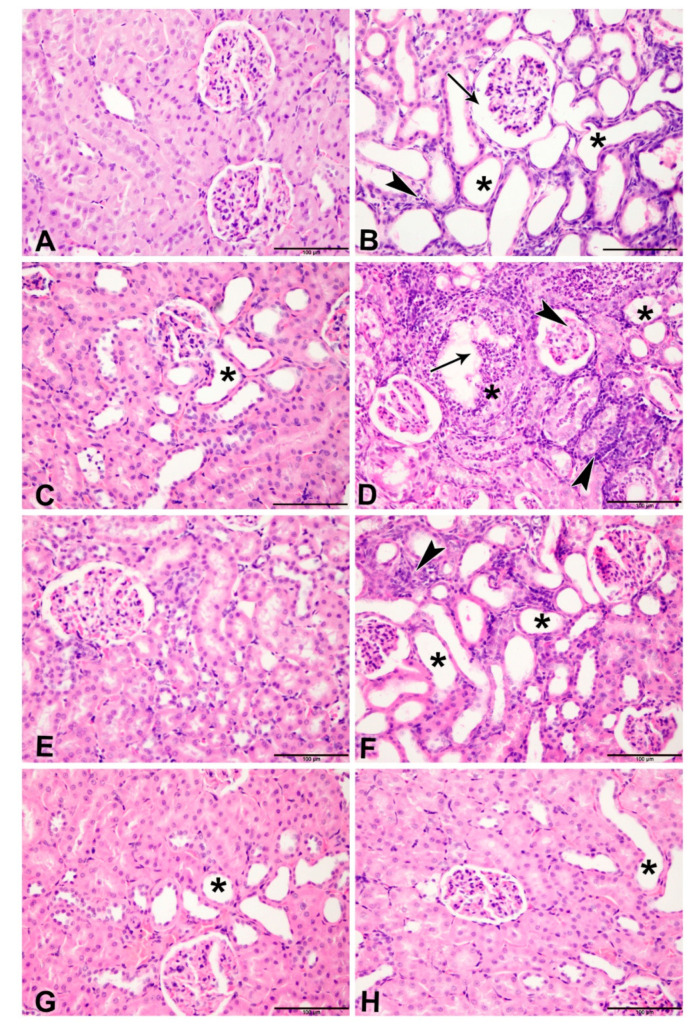
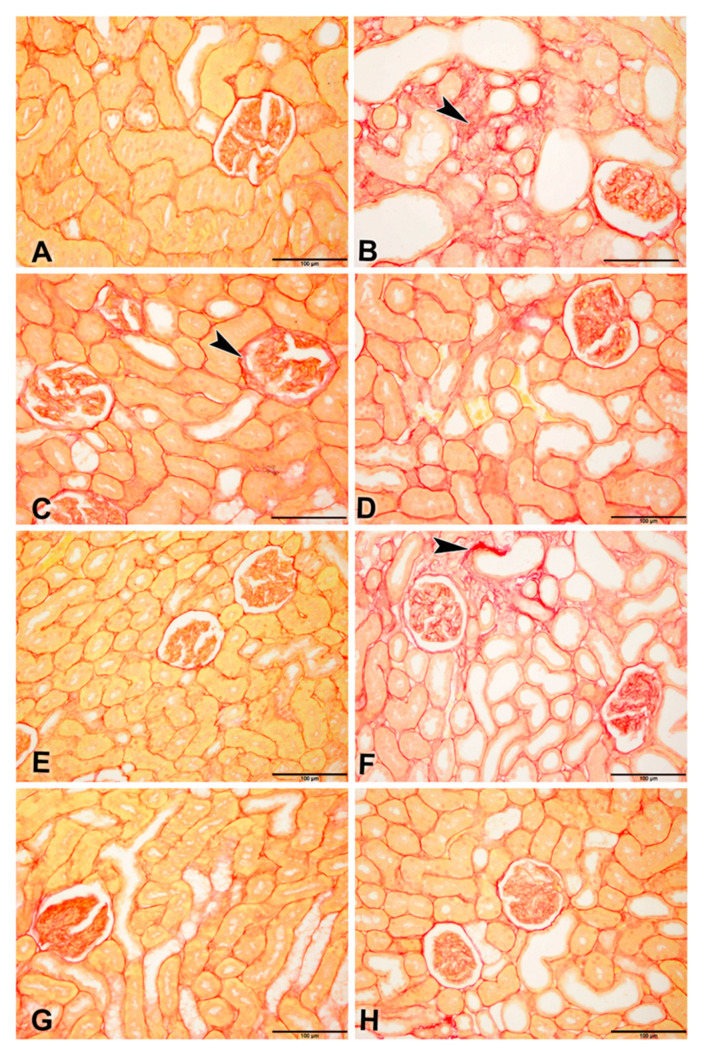
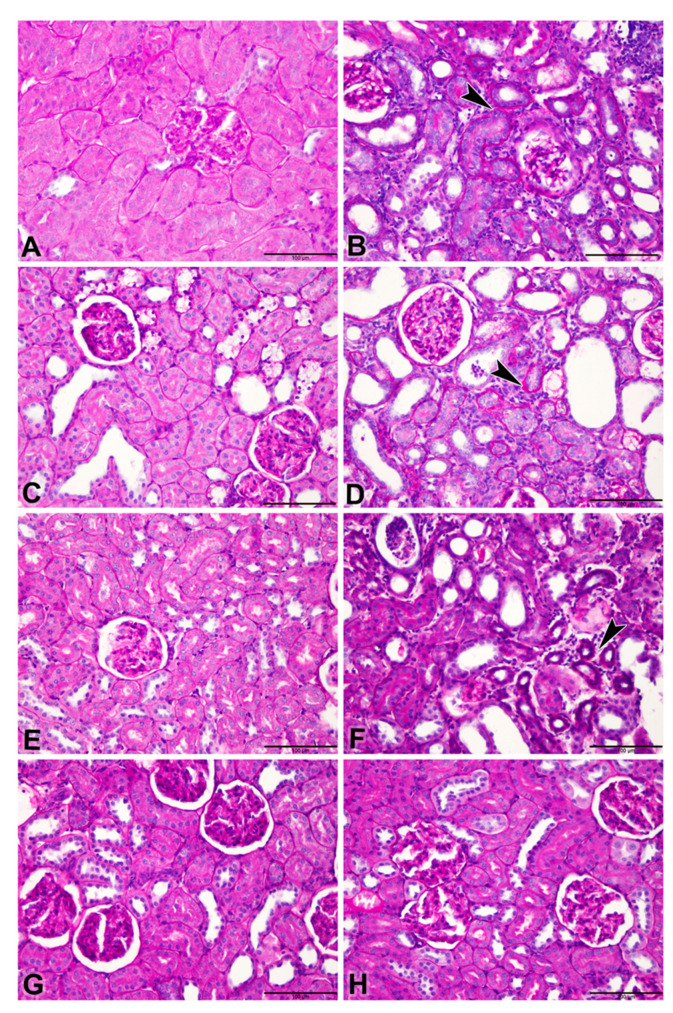
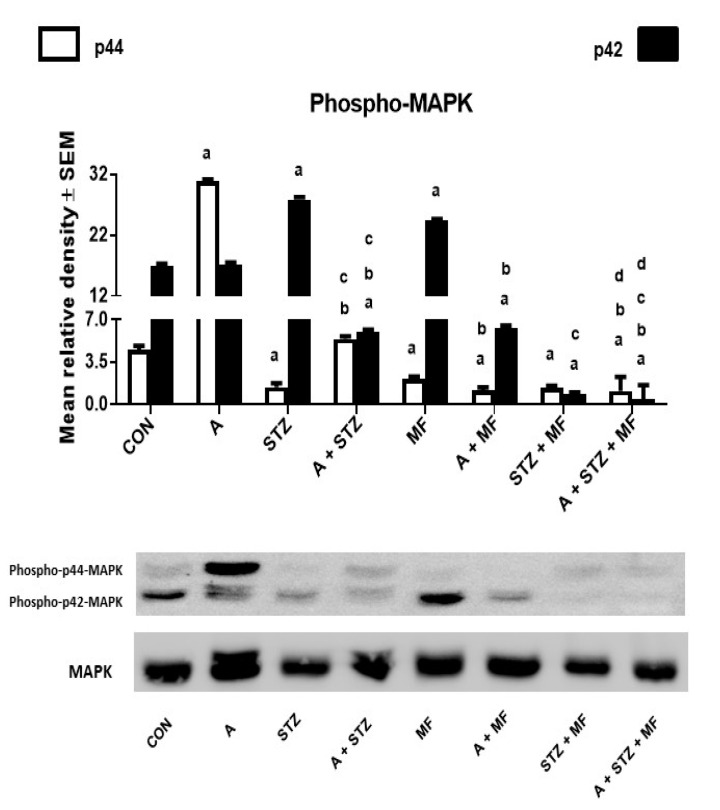
This work aimed to investigate whether treatment with the antidiabetic drug metformin would affect adenine-induced chronic kidney disease (CKD) in non-diabetic rats and rats with streptozotocin (STZ)-induced diabetes. Rats were randomly divided into eight groups, and given either normal feed, or feed mixed with adenine (0.25% w/w, for five weeks) to induce CKD. Some of these groups were also simultaneously treated orally with metformin (200 mg/kg/day). Rats given adenine showed the typical signs of CKD that included detrimental changes in several physiological and traditional and novel biochemical biomarkers in plasma urine and kidney homogenates such as albumin/creatinine ratio, N-acetyl-beta-D-glucosaminidase, neutrophil gelatinase-associated lipocalin, 8-isoprostane, adiponectin, cystatin C, as well as plasma urea, creatinine, uric acid, indoxyl sulfate, calcium, and phosphorus. Several indices of inflammation and oxidative stress, and renal nuclear factor-κB and nuclear factor erythroid 2-related factor 2 levels were also measured. Histopathologically, adenine caused renal tubular necrosis and fibrosis. The activation of the intracellular mitogen-activated protein kinase signaling pathway was inhibited in the groups that received metformin and STZ together, with or without adenine induced-CKD. Induction of diabetes worsened most of the actions induced by adenine. Metformin significantly ameliorated the renal actions induced by adenine and STZ when these were given singly, and more so when given together. The results suggest that metformin can be a useful drug in attenuating the progression of CKD in both diabetic and non-diabetic rats.
Keywords: adenine; chronic kidney disease; diabetes; metformin; rats.
Conflict of interest statement
The authors declare no conflict of interest.
Figures
Similar articles
-
Gum Acacia Improves Renal Function and Ameliorates Systemic Inflammation, Oxidative and Nitrosative Stress in Streptozotocin-Induced Diabetes in Rats with Adenine-Induced Chronic Kidney Disease.Cell Physiol Biochem. 2018;45(6):2293-2304. doi: 10.1159/000488176. Epub 2018 Mar 13. Cell Physiol Biochem. 2018. PMID: 29550811
-
Effect of flaxseed on systemic inflammation and oxidative stress in diabetic rats with or without chronic kidney disease.PLoS One. 2021 Oct 19;16(10):e0258800. doi: 10.1371/journal.pone.0258800. eCollection 2021. PLoS One. 2021. PMID: 34665824 Free PMC article.
-
Effects of the SGLT-2 Inhibitor Canagliflozin on Adenine-Induced Chronic Kidney Disease in Rats.Cell Physiol Biochem. 2019;52(1):27-39. doi: 10.33594/000000003. Epub 2019 Feb 18. Cell Physiol Biochem. 2019. PMID: 30790503
-
Metformin: A Candidate Drug for Renal Diseases.Int J Mol Sci. 2018 Dec 21;20(1):42. doi: 10.3390/ijms20010042. Int J Mol Sci. 2018. PMID: 30583483 Free PMC article. Review.
-
Adenine-induced animal model of chronic kidney disease: current applications and future perspectives.Ren Fail. 2024 Dec;46(1):2336128. doi: 10.1080/0886022X.2024.2336128. Epub 2024 Apr 4. Ren Fail. 2024. PMID: 38575340 Free PMC article. Review.
Cited by
-
The efficacy of using metformin and/or quercetin for amelioration of gamma-irradiation induced tongue toxicity in diabetic rats.BMC Oral Health. 2024 Jan 18;24(1):110. doi: 10.1186/s12903-024-03871-0. BMC Oral Health. 2024. PMID: 38238729 Free PMC article.
-
Effect of New Antidiabetics on Steatosis in Nerve Tissues and Nerve Conduction Velocity: Possible Role of Nerve Growth Factor (NGF)/Synaptophysin and Nrf2/HO-1 Pathways.Cureus. 2024 Jul 30;16(7):e65726. doi: 10.7759/cureus.65726. eCollection 2024 Jul. Cureus. 2024. PMID: 39211670 Free PMC article.
-
IRW (Isoleucine-Arginine-Tryptophan) Improves Glucose Tolerance in High Fat Diet Fed C57BL/6 Mice via Activation of Insulin Signaling and AMPK Pathways in Skeletal Muscle.Biomedicines. 2022 May 26;10(6):1235. doi: 10.3390/biomedicines10061235. Biomedicines. 2022. PMID: 35740257 Free PMC article.
-
Comparative effects of metformin and varying intensities of exercise on miR-133a expression in diabetic rats: Insights from machine learning analysis.Biochem Biophys Rep. 2024 Nov 23;40:101882. doi: 10.1016/j.bbrep.2024.101882. eCollection 2024 Dec. Biochem Biophys Rep. 2024. PMID: 39649797 Free PMC article.
-
Metformin and Canagliflozin Are Equally Renoprotective in Diabetic Kidney Disease but Have No Synergistic Effect.Int J Mol Sci. 2023 May 20;24(10):9043. doi: 10.3390/ijms24109043. Int J Mol Sci. 2023. PMID: 37240387 Free PMC article.
References
-
- Ali B.H., Al-Salam S., Al Za’Abi M., Waly M.I., Ramkumar A., Beegam S., Al-Lawati I., Adham S.A., Nemmar A. New model for adenine-induced chronic renal failure in mice, and the effect of gum acacia treatment thereon: Comparison with rats. J. Pharmacol. Toxicol. Methods. 2013;68:384–393. doi: 10.1016/j.vascn.2013.05.001. - DOI - PubMed
Publication types
MeSH terms
Substances
LinkOut - more resources
Full Text Sources
Medical
