

GLUT-1 Enhances Glycolysis, Oxidative Stress, and Fibroblast Proliferation in Keloid
- PMID: 34070830
- PMCID: PMC8229441
- DOI: 10.3390/life11060505
GLUT-1 Enhances Glycolysis, Oxidative Stress, and Fibroblast Proliferation in Keloid
Abstract
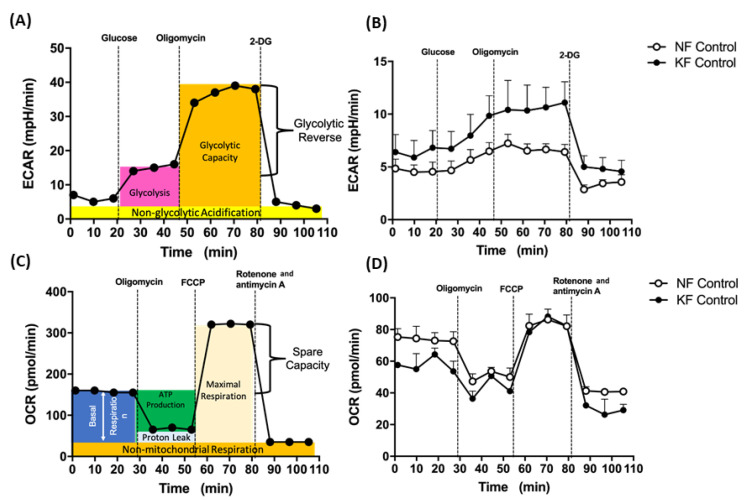
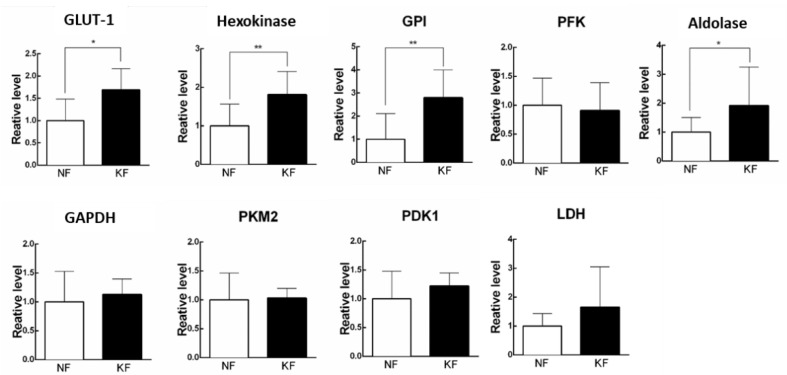
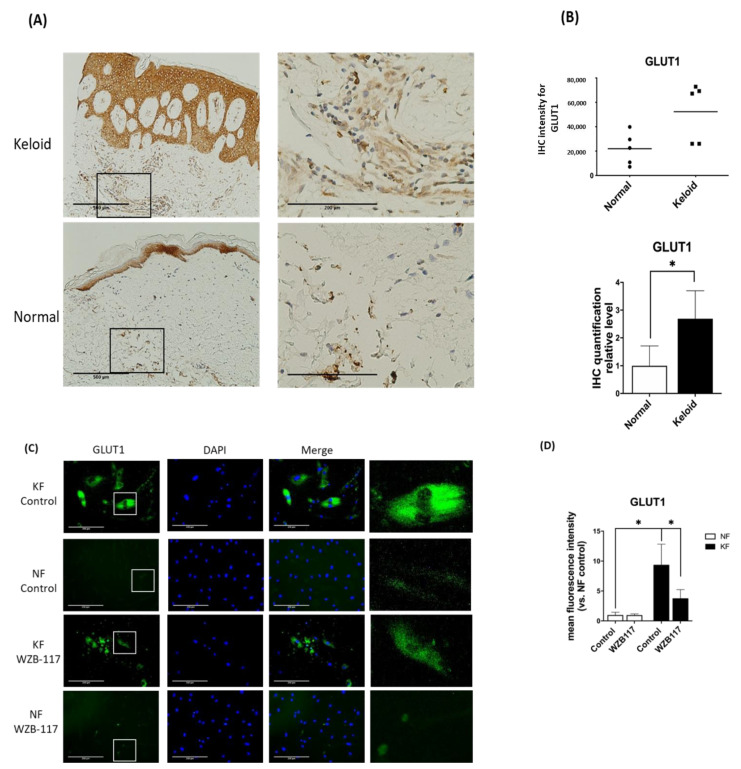
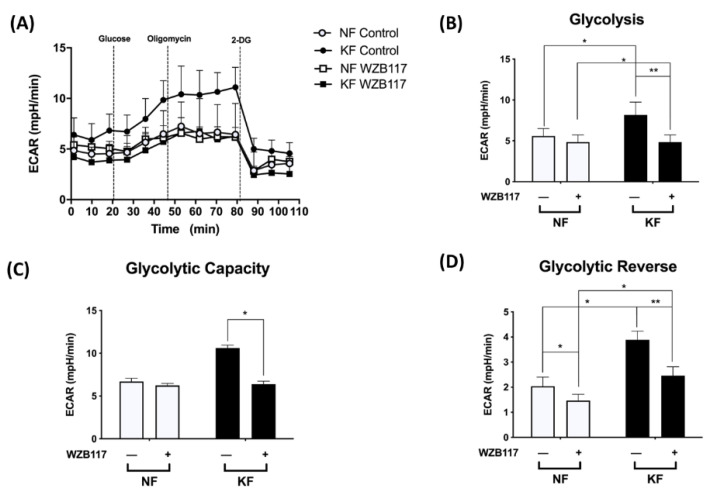
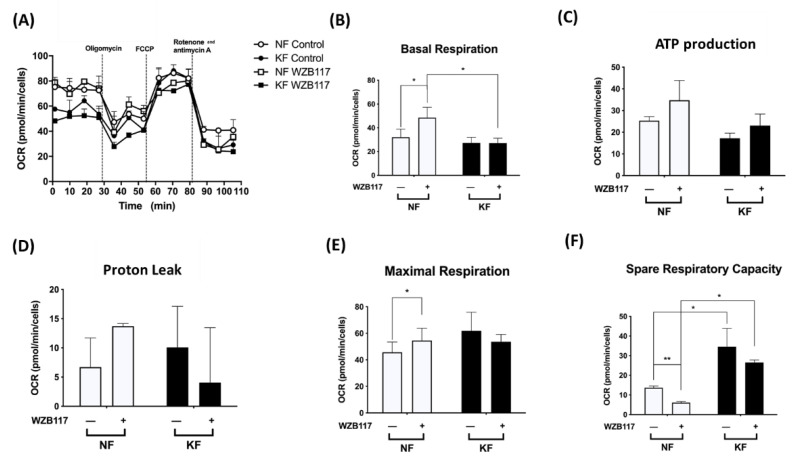
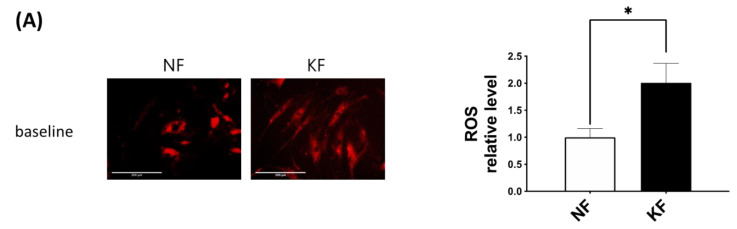
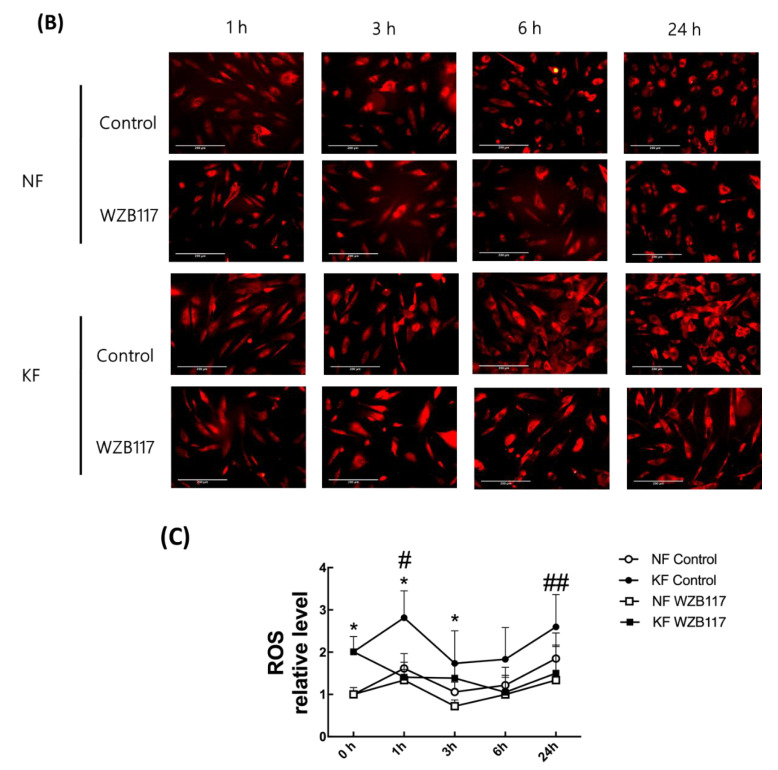
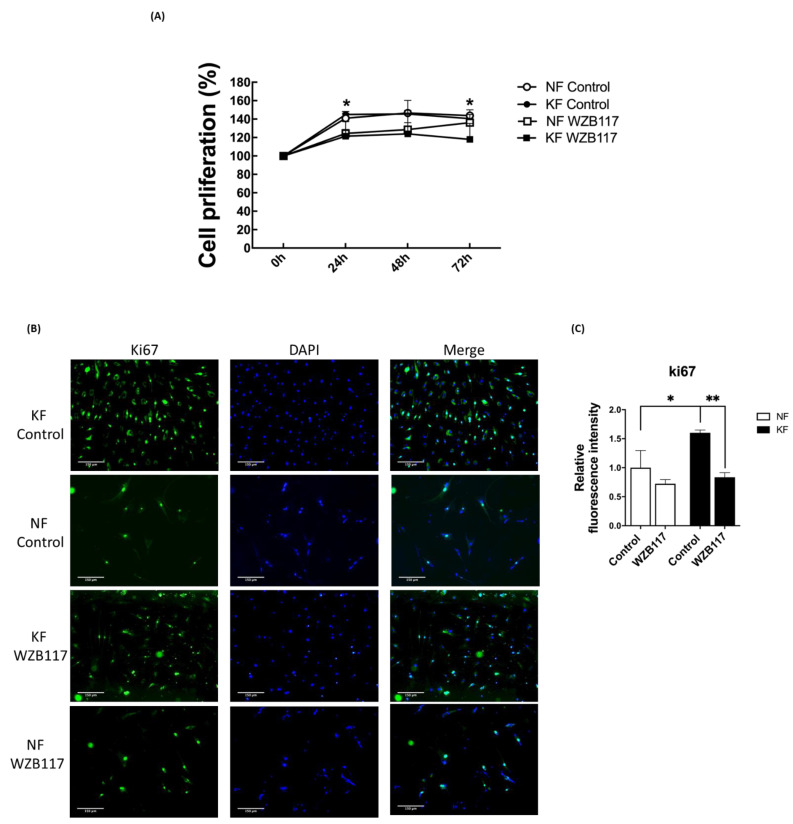
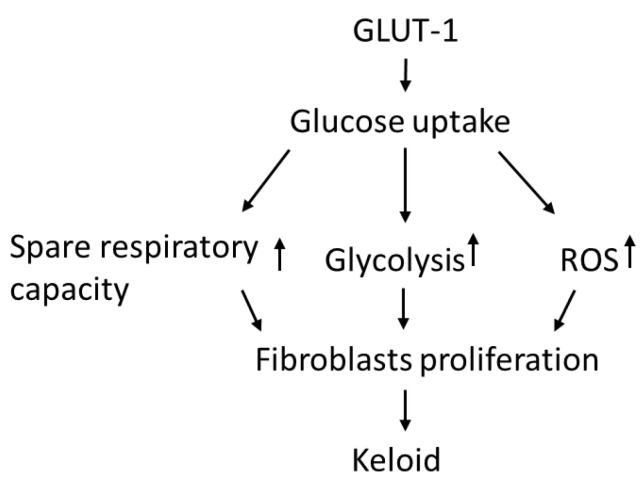
A keloid is a fibroproliferative skin tumor. Proliferating keloid fibroblasts (KFs) demand active metabolic utilization. The contributing roles of glycolysis and glucose metabolism in keloid fibroproliferation remain unclear. This study aims to determine the regulation of glycolysis and glucose metabolism by glucose transporter-1 (GLUT-1), an essential protein to initiate cellular glucose uptake, in keloids and in KFs. Tissues of keloids and healthy skin were explanted for KFs and normal fibroblasts (NFs), respectively. GLUT-1 expression was measured by immunofluorescence, RT-PCR, and immunoblotting. The oxygen consumption rate (OCR) and extracellular acidification rate (ECAR) were measured with or without WZB117, a GLUT-1 inhibitor. Reactive oxygen species (ROS) were assayed by MitoSOX immunostaining. The result showed that glycolysis (ECAR) was enhanced in KFs, whereas OCR was not. GLUT-1 expression was selectively increased in KFs. Consistently, GLUT-1 expression was increased in keloid tissue. Treatment with WZB117 abolished the enhanced ECAR, including glycolysis and glycolytic capacity, in KFs. ROS levels were increased in KFs compared to those in NFs. GLUT-1 inhibition suppressed not only the ROS levels but also the cell proliferation in KFs. In summary, the GLUT-1-dependent glycolysis and ROS production mediated fibroblast proliferation in keloids. GLUT1 might be a potential target for metabolic reprogramming to treat keloids.
Keywords: glucose transporter 1 (GLUT-1); glycolysis; keloids; proliferation; reactive oxygen species (ROS).
Conflict of interest statement
The authors declare no conflict of interest. The funders had no role in the design of the study; in the collection, analyses, or interpretation of data; in the writing of the manuscript, or in the decision to publish the results.
Figures
Similar articles
-
Metabolic reprogramming in keloid fibroblasts: Aerobic glycolysis and a novel therapeutic strategy.Biochem Biophys Res Commun. 2018 Feb 5;496(2):641-647. doi: 10.1016/j.bbrc.2018.01.068. Epub 2018 Jan 11. Biochem Biophys Res Commun. 2018. PMID: 29337061
-
NEDD4L Inhibits the Proliferation and Migration of Keloid Fibroblasts by Regulating YY1 Ubiquitination-Mediated Glycolytic Metabolic Reprogramming.Exp Dermatol. 2024 Nov;33(11):e70008. doi: 10.1111/exd.70008. Exp Dermatol. 2024. PMID: 39494931
-
CA9-Positive Keloid Fibroblasts: Modulator of Local Inflammation Induced by the Hypoxic and Glycolysis-enhanced Microenvironment.Anticancer Res. 2025 Jun;45(6):2429-2442. doi: 10.21873/anticanres.17614. Anticancer Res. 2025. PMID: 40425327
-
An appraisal of the current status of inhibition of glucose transporters as an emerging antineoplastic approach: Promising potential of new pan-GLUT inhibitors.Front Pharmacol. 2022 Nov 1;13:1035510. doi: 10.3389/fphar.2022.1035510. eCollection 2022. Front Pharmacol. 2022. PMID: 36386187 Free PMC article. Review.
-
Development of Glucose Transporter (GLUT) Inhibitors.European J Org Chem. 2020 May 3;2020(16):2321-2329. doi: 10.1002/ejoc.201901353. Epub 2019 Nov 28. European J Org Chem. 2020. PMID: 32421048 Free PMC article. Review.
Cited by
-
Phosphorylation of FOXK2 at Thr13 and Ser30 by PDK2 sustains glycolysis through a positive feedback manner in ovarian cancer.Oncogene. 2024 Jun;43(26):1985-1999. doi: 10.1038/s41388-024-03052-x. Epub 2024 May 11. Oncogene. 2024. PMID: 38734828 Free PMC article.
-
Biomechanical Regulatory Factors and Therapeutic Targets in Keloid Fibrosis.Front Pharmacol. 2022 May 9;13:906212. doi: 10.3389/fphar.2022.906212. eCollection 2022. Front Pharmacol. 2022. PMID: 35614943 Free PMC article. Review.
-
Enhanced bioenergetic cellular activity with metabolic switch to aerobic glycolysis in Keloid and Folliculitis Keloidalis Nuchae.Arch Dermatol Res. 2024 Jun 15;316(7):412. doi: 10.1007/s00403-024-03038-5. Arch Dermatol Res. 2024. PMID: 38878082 Free PMC article.
-
PIGT promotes cell growth, glycolysis, and metastasis in bladder cancer by modulating GLUT1 glycosylation and membrane trafficking.J Transl Med. 2024 Jan 2;22(1):5. doi: 10.1186/s12967-023-04805-0. J Transl Med. 2024. PMID: 38169393 Free PMC article.
-
The WWOX/HIF1A Axis Downregulation Alters Glucose Metabolism and Predispose to Metabolic Disorders.Int J Mol Sci. 2022 Mar 19;23(6):3326. doi: 10.3390/ijms23063326. Int J Mol Sci. 2022. PMID: 35328751 Free PMC article.
References
Grants and funding
LinkOut - more resources
Full Text Sources
Miscellaneous
