

CALD1 Modulates Gliomas Progression via Facilitating Tumor Angiogenesis
- PMID: 34070840
- PMCID: PMC8199308
- DOI: 10.3390/cancers13112705
CALD1 Modulates Gliomas Progression via Facilitating Tumor Angiogenesis
Abstract
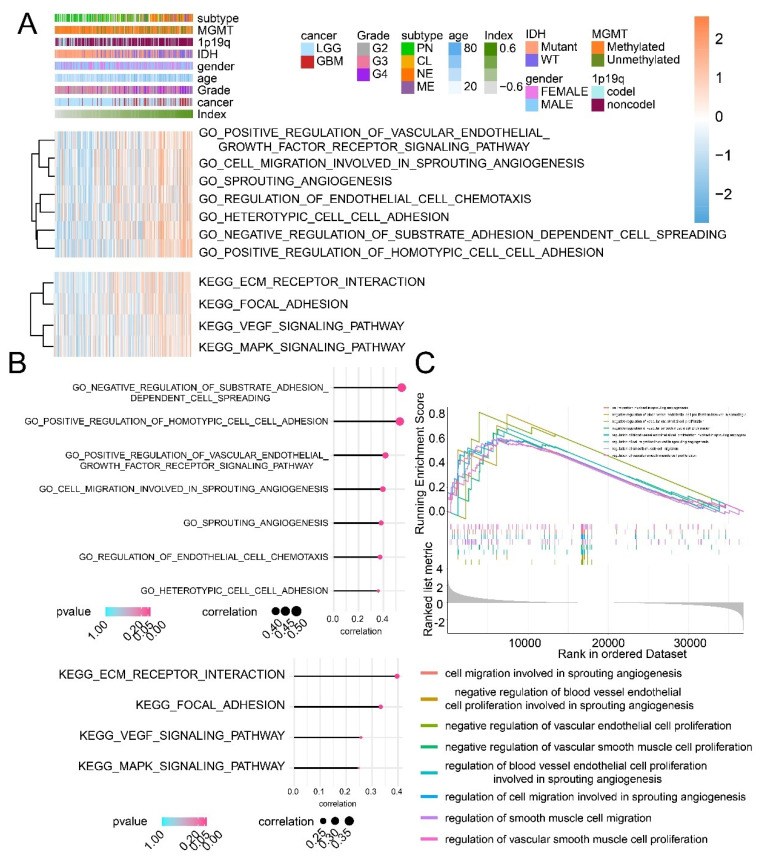
Angiogenesis is more prominent in anaplastic gliomas and glioblastoma (GBM) than that in pilocytic and diffuse gliomas. Caldesmon (CALD1) plays roles in cell adhesion, cytoskeletal organization, and vascularization. However, limited information is available on mechanisms underlying the effect of CALD1 on the microvascular facilitation and architecture in glioma. In this study, we explored the role of CALD1 in gliomas by integrating bulk RNA-seq analysis and single cell RNA-seq analysis. A positive correlation between CALD1 expression and the gliomas' pathological grade was noticed, according to the samples from the TCGA and CGGA database. Moreover, higher CALD1 expression samples showed worse clinical outcomes than lower CALD1 expression samples. Biofunction prediction suggested that CALD1 may affect glioma progression through modulating tumor angiogenesis. The map of the tumor microenvironment also depicted that more stromal cells, such as endothelial cells and pericytes, infiltrated in high CALD1 expression samples. CALD1 was found to be remarkably upregulated in neoplastic cells and was involved in tumorigenic processes of gliomas in single cell sequencing analysis. Histology and immunofluorescence analysis also indicated that CALD1 associates with vessel architecture, resulting in glioma grade progression. In conclusion, the present study implies that CALD1 may serve as putative marker monitoring the progress of glioma.
Keywords: CALD1; angiogenesis; brain tumor; glioma.
Conflict of interest statement
The authors declare no conflict of interest.
Figures


Similar articles
-
Emerging role of caldesmon in cancer: A potential biomarker for colorectal cancer and other cancers.World J Gastrointest Oncol. 2022 Sep 15;14(9):1637-1653. doi: 10.4251/wjgo.v14.i9.1637. World J Gastrointest Oncol. 2022. PMID: 36187394 Free PMC article. Review.
-
Elevated Na/H exchanger 1 (SLC9A1) emerges as a marker for tumorigenesis and prognosis in gliomas.J Exp Clin Cancer Res. 2018 Oct 17;37(1):255. doi: 10.1186/s13046-018-0923-z. J Exp Clin Cancer Res. 2018. PMID: 30333031 Free PMC article.
-
Comprehensive analysis to identify the relationship between CALD1 and immune infiltration in glioma.Transl Cancer Res. 2024 Jul 31;13(7):3354-3369. doi: 10.21037/tcr-24-216. Epub 2024 Jul 26. Transl Cancer Res. 2024. PMID: 39145081 Free PMC article.
-
Weighted Gene Co-expression Network Analysis Identifies CALD1 as a Biomarker Related to M2 Macrophages Infiltration in Stage III and IV Mismatch Repair-Proficient Colorectal Carcinoma.Front Mol Biosci. 2021 Apr 29;8:649363. doi: 10.3389/fmolb.2021.649363. eCollection 2021. Front Mol Biosci. 2021. PMID: 33996905 Free PMC article.
-
Angiogenesis in malignant gliomas.Glia. 1995 Nov;15(3):339-47. doi: 10.1002/glia.440150313. Glia. 1995. PMID: 8586468 Review.
Cited by
-
New phase therapeutic pursuits for targeted drug delivery in glioblastoma multiforme.Explor Target Antitumor Ther. 2022;3(6):866-888. doi: 10.37349/etat.2022.00118. Epub 2022 Dec 30. Explor Target Antitumor Ther. 2022. PMID: 36654821 Free PMC article. Review.
-
Emerging role of caldesmon in cancer: A potential biomarker for colorectal cancer and other cancers.World J Gastrointest Oncol. 2022 Sep 15;14(9):1637-1653. doi: 10.4251/wjgo.v14.i9.1637. World J Gastrointest Oncol. 2022. PMID: 36187394 Free PMC article. Review.
-
The Heterogeneity of Infiltrating Macrophages in Metastatic Osteosarcoma and Its Correlation with Immunotherapy.J Oncol. 2021 Jul 21;2021:4836292. doi: 10.1155/2021/4836292. eCollection 2021. J Oncol. 2021. PMID: 34335756 Free PMC article.
-
A novel prognostic related lncRNA signature associated with amino acid metabolism in glioma.Front Immunol. 2023 Apr 11;14:1014378. doi: 10.3389/fimmu.2023.1014378. eCollection 2023. Front Immunol. 2023. PMID: 37114036 Free PMC article.
-
Hub biomarkers in ultrasound-guided bladder cancer and osteosarcoma: Myosin light chain kinase and caldesmon.Medicine (Baltimore). 2023 Dec 1;102(48):e36414. doi: 10.1097/MD.0000000000036414. Medicine (Baltimore). 2023. PMID: 38050320 Free PMC article.
References
Grants and funding
LinkOut - more resources
Full Text Sources
Miscellaneous
