

The Protraction and Retraction Angles of Horse Limbs: An Estimation during Trotting Using Inertial Sensors
- PMID: 34070859
- PMCID: PMC8199102
- DOI: 10.3390/s21113792
The Protraction and Retraction Angles of Horse Limbs: An Estimation during Trotting Using Inertial Sensors
Abstract
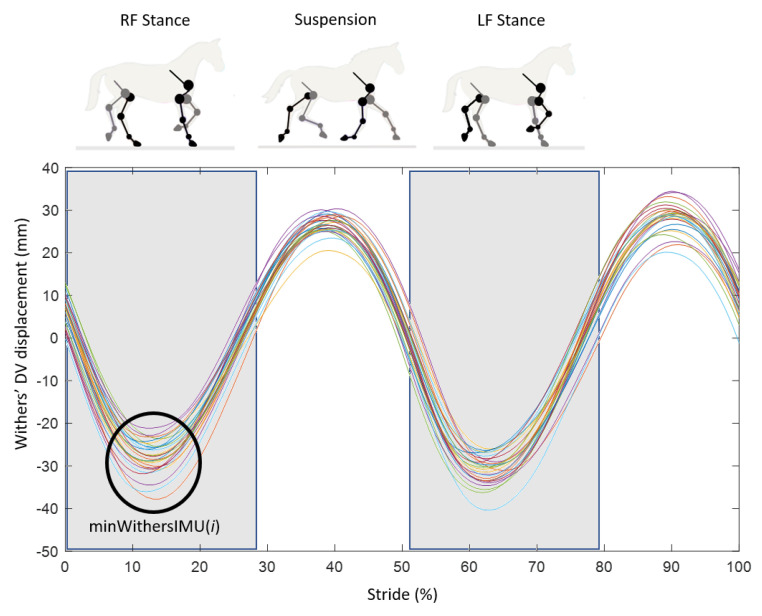
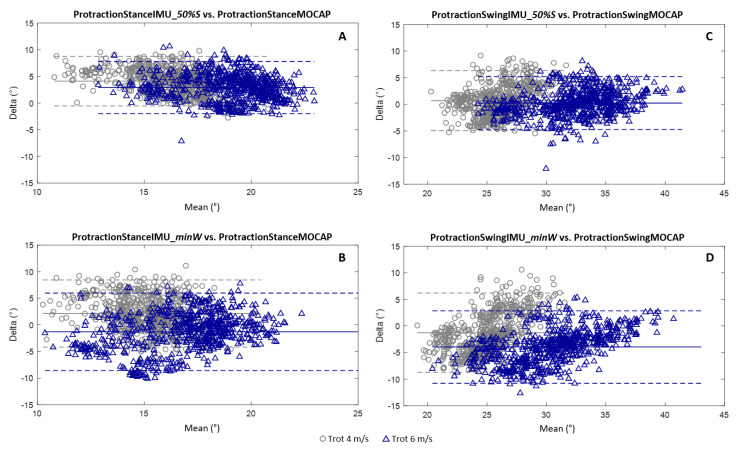
The protraction and retraction angles of horse limbs are important in the analysis of horse locomotion. This study explored two methods from an IMU positioned on the canon bone of eight horses to estimate these angles. Each method was based on a hypothesis in order to define the moment corresponding with the verticality of the canon bone: (i) the canon bone is in a vertical position at 50% of the stance phase or (ii) the verticality of the canon bone corresponds with the moment when the horse's withers reach their lowest point. The measurements were carried out on a treadmill at a trot and compared with a standard gold method based on motion capture. For the measurement of the maximum protraction and retraction angles, method (i) had average biases (0.7° and 1.7°) less than method (ii) (-1.3° and 3.7°). For the measurement of the protraction and retraction angles during the stance phase, method (i) had average biases (4.1° and -3.3°) higher to method (ii) (2.1° and -1.3°). This study investigated the pros and cons of a generic method (i) vs. a specific method (ii) to determine the protraction and retraction angles of horse limbs by a single IMU.
Keywords: biomechanics; horse; inertial measurement units; limb angles; locomotion; method comparison; protraction; retraction.
Conflict of interest statement
The authors declare no conflict of interest.
Figures


Similar articles
-
Comparison of Trotting Stance Detection Methods from an Inertial Measurement Unit Mounted on the Horse's Limb.Sensors (Basel). 2020 May 25;20(10):2983. doi: 10.3390/s20102983. Sensors (Basel). 2020. PMID: 32466104 Free PMC article.
-
Effects of the rider on the kinematics of the equine spine under the saddle during the trot using inertial measurement units: Methodological study and preliminary results.Vet J. 2017 Mar;221:6-10. doi: 10.1016/j.tvjl.2016.12.018. Epub 2017 Jan 3. Vet J. 2017. PMID: 28283082
-
Comparison of limb loading and movement of Icelandic horses while tölting and trotting at equal speeds.Am J Vet Res. 2015 Dec;76(12):1031-40. doi: 10.2460/ajvr.76.12.1031. Am J Vet Res. 2015. PMID: 26618727
-
Inertial Sensor Technologies-Their Role in Equine Gait Analysis, a Review.Sensors (Basel). 2023 Jul 11;23(14):6301. doi: 10.3390/s23146301. Sensors (Basel). 2023. PMID: 37514599 Free PMC article. Review.
-
The use of high-speed treadmills for lameness and hoof balance evaluations in the horse.Vet Clin North Am Equine Pract. 1991 Aug;7(2):271-309. doi: 10.1016/s0749-0739(17)30501-1. Vet Clin North Am Equine Pract. 1991. PMID: 1933565 Review.
Cited by
-
A Method for Quantifying Back Flexion/Extension from Three Inertial Measurement Units Mounted on a Horse's Withers, Thoracolumbar Region, and Pelvis.Sensors (Basel). 2023 Dec 5;23(24):9625. doi: 10.3390/s23249625. Sensors (Basel). 2023. PMID: 38139471 Free PMC article.
-
Gait kinematics at trot before and after repeated ridden exercise tests in young Friesian stallions during a fatiguing 10-week training program.Front Vet Sci. 2025 Feb 10;12:1456424. doi: 10.3389/fvets.2025.1456424. eCollection 2025. Front Vet Sci. 2025. PMID: 39995550 Free PMC article.
-
Quantification of the Effect of Saddle Fitting on Rider-Horse Biomechanics Using Inertial Measurement Units.Sensors (Basel). 2025 Jul 30;25(15):4712. doi: 10.3390/s25154712. Sensors (Basel). 2025. PMID: 40807876 Free PMC article.
-
Fetlock Joint Angle Pattern and Range of Motion Quantification Using Two Synchronized Wearable Inertial Sensors per Limb in Sound Horses and Horses with Single Limb Naturally Occurring Lameness.Vet Sci. 2022 Aug 25;9(9):456. doi: 10.3390/vetsci9090456. Vet Sci. 2022. PMID: 36136672 Free PMC article.
-
Detection of Horse Locomotion Modifications Due to Training with Inertial Measurement Units: A Proof-of-Concept.Sensors (Basel). 2022 Jul 1;22(13):4981. doi: 10.3390/s22134981. Sensors (Basel). 2022. PMID: 35808476 Free PMC article.
References
-
- Crevier-Denoix N., Falala S., Holden-Douilly L., Camus M., Martino J., Ravary-Plumioen B., Vergari C., Desquilbet L., Denoix J.-M., Chateau H. Comparative kinematic analysis of the leading and trailing forelimbs of horses cantering on a turf and a synthetic surface: Forelimb kinematics at the canter on turf and synthetic surfaces. Equine Vet. J. 2013;45:54–61. doi: 10.1111/evj.12160. - DOI - PubMed
MeSH terms
LinkOut - more resources
Full Text Sources
Miscellaneous
