

Metabolic Response of Pancreatic Carcinoma Cells under Treatment with Dichloroacetate
- PMID: 34070873
- PMCID: PMC8228235
- DOI: 10.3390/metabo11060350
Metabolic Response of Pancreatic Carcinoma Cells under Treatment with Dichloroacetate
Abstract
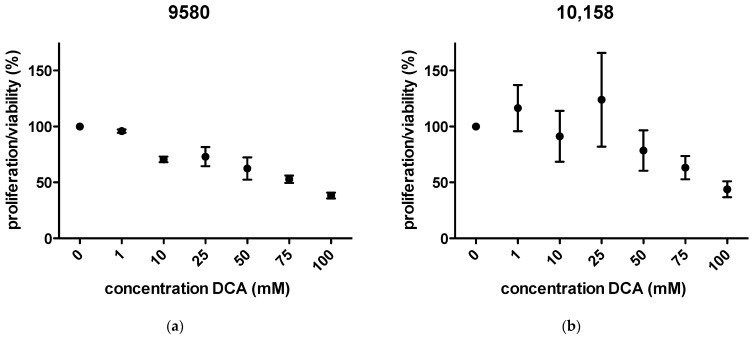
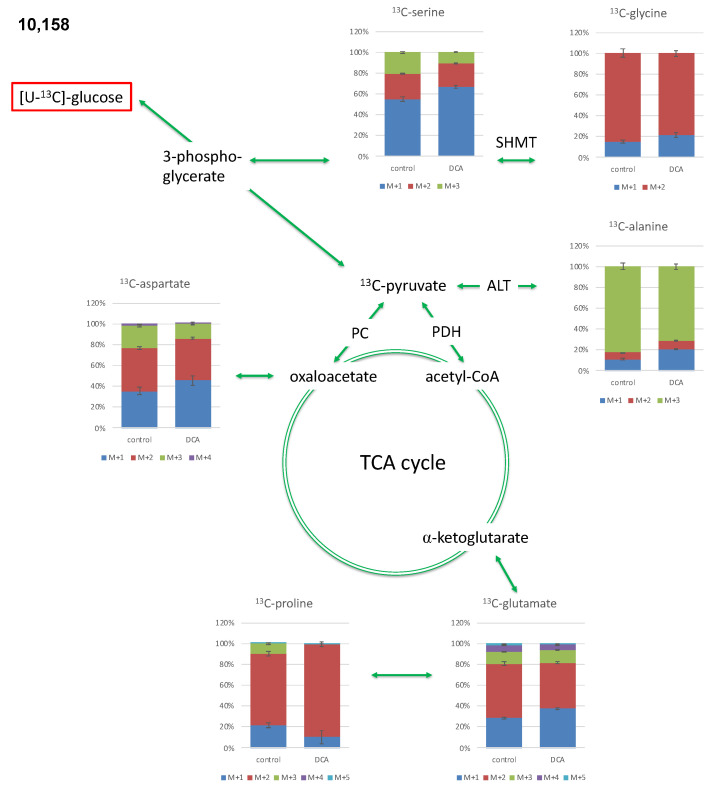
In modern oncology, the analysis and evaluation of treatment response are still challenging. Hence, we used a 13C-guided approach to study the impacts of the small molecule dichloroacetate (DCA) upon the metabolic response of pancreatic cancer cells. Two different oncogenic PI3K-driven pancreatic cancer cell lines, 9580 and 10,158, respectively, were treated with 75 mM DCA for 18 h. In the presence of [U-13C6]glucose, the effects of DCA treatment in the core carbon metabolism were analyzed in these cells using gas chromatography-mass spectrometry (GC/MS). 13C-enrichments and isotopologue profiles of key amino acids revealed considerable effects of the DCA treatment upon glucose metabolism. The DCA treatment of the two pancreatic cell lines resulted in a significantly decreased incorporation of [U-13C6]glucose into the amino acids alanine, aspartate, glutamate, glycine, proline and serine in treated, but not in untreated, cancer cells. For both cell lines, the data indicated some activation of pyruvate dehydrogenase with increased carbon flux via the TCA cycle, but also massive inhibition of glycolytic flux and amino acid biosynthesis presumably by inhibition of the PI3K/Akt/mTORC axis. Together, it appears worthwhile to study the early treatment response in DCA-guided or accompanied cancer therapy in more detail, since it could open new avenues for improved diagnosis and therapeutic protocols of cancer.
Keywords: [U-13C6]glucose; dichloroacetate (DCA); isotopologue profiling; pancreatic cancer.
Conflict of interest statement
The authors declare no conflict of interest. The funders had no role in the design of the study; in the collection, analyses, or interpretation of data; in the writing of the manuscript, or in the decision to publish the results.
Figures


Similar articles
-
Diverse metabolic response of cancer cells treated with a 213Bi-anti-EGFR-immunoconjugate.Sci Rep. 2021 Mar 18;11(1):6227. doi: 10.1038/s41598-021-84421-4. Sci Rep. 2021. PMID: 33737524 Free PMC article.
-
In vitro effects of dichloroacetate and CO2 on hypoxic HeLa cells.Anticancer Res. 2009 Nov;29(11):4579-88. Anticancer Res. 2009. PMID: 20032407
-
Multi-modality imaging to assess metabolic response to dichloroacetate treatment in tumor models.Oncotarget. 2016 Dec 6;7(49):81741-81749. doi: 10.18632/oncotarget.13176. Oncotarget. 2016. PMID: 28082726 Free PMC article.
-
[Sodium dichloroacetate--a substance with manifold therapeutic potential].Wien Klin Wochenschr. 1990 Feb 2;102(3):65-9. Wien Klin Wochenschr. 1990. PMID: 2180210 Review. German.
-
Dichloroacetate-induced peripheral neuropathy.Int Rev Neurobiol. 2019;145:211-238. doi: 10.1016/bs.irn.2019.05.003. Epub 2019 Jun 11. Int Rev Neurobiol. 2019. PMID: 31208525 Review.
Cited by
-
Second-Line Treatment of Pancreatic Adenocarcinoma: Shedding Light on New Opportunities and Key Talking Points from Clinical Trials.Clin Exp Gastroenterol. 2024 Apr 18;17:121-134. doi: 10.2147/CEG.S390655. eCollection 2024. Clin Exp Gastroenterol. 2024. PMID: 38650920 Free PMC article. Review.
-
Integrative metabolic flux analysis reveals an indispensable dimension of phenotypes.Curr Opin Biotechnol. 2022 Jun;75:102701. doi: 10.1016/j.copbio.2022.102701. Epub 2022 Mar 9. Curr Opin Biotechnol. 2022. PMID: 35278746 Free PMC article. Review.
-
In-vivo magnetic resonance spectroscopy of lactate as a non-invasive biomarker of dichloroacetate activity in cancer and non-cancer central nervous system disorders.Front Oncol. 2023 Mar 17;13:1077461. doi: 10.3389/fonc.2023.1077461. eCollection 2023. Front Oncol. 2023. PMID: 37007074 Free PMC article. Review.
-
Dichloroacetate for Cancer Treatment: Some Facts and Many Doubts.Pharmaceuticals (Basel). 2024 Jun 6;17(6):744. doi: 10.3390/ph17060744. Pharmaceuticals (Basel). 2024. PMID: 38931411 Free PMC article. Review.
References
-
- Aichler M., Seiler C., Tost M., Siveke J., Mazur P.K., Da Silva-Buttkus P., Bartsch D.K., Langer P., Chiblak S., Dürr A., et al. Origin of pancreatic ductal adenocarcinoma from atypical flat lesions: A comparative study in transgenic mice and human tissues. J. Pathol. 2011;226:723–734. doi: 10.1002/path.3017. - DOI - PubMed
Grants and funding
LinkOut - more resources
Full Text Sources
Miscellaneous
