

Quantifying the Effects of Social Distancing on the Spread of COVID-19
- PMID: 34071047
- PMCID: PMC8197116
- DOI: 10.3390/ijerph18115566
Quantifying the Effects of Social Distancing on the Spread of COVID-19
Abstract
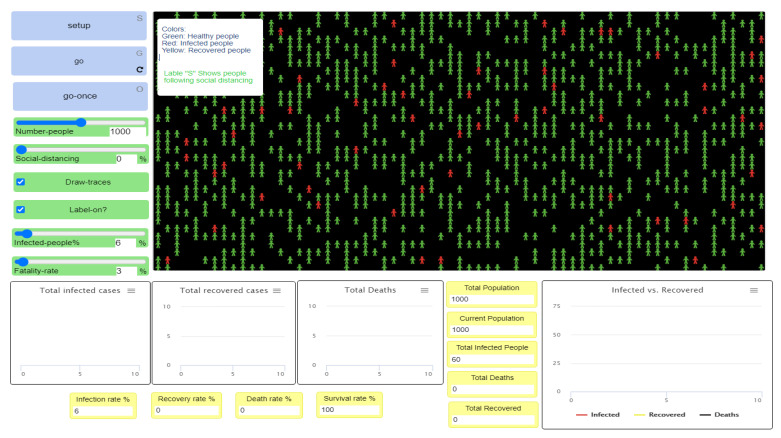
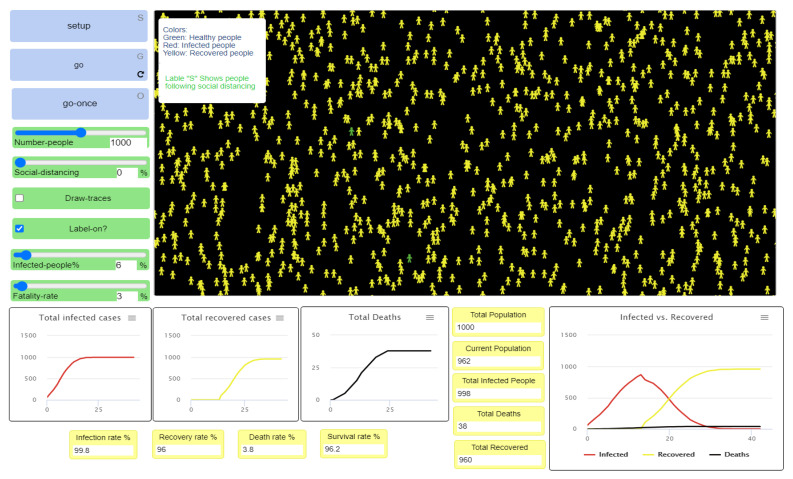
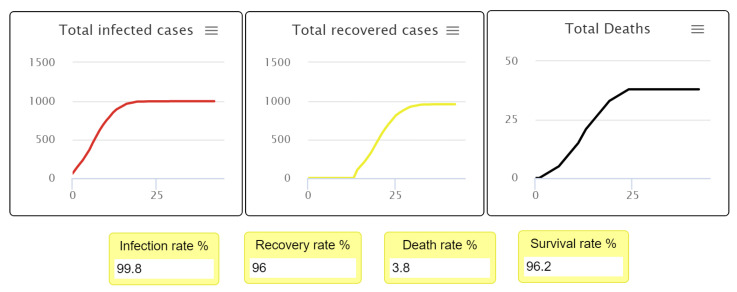
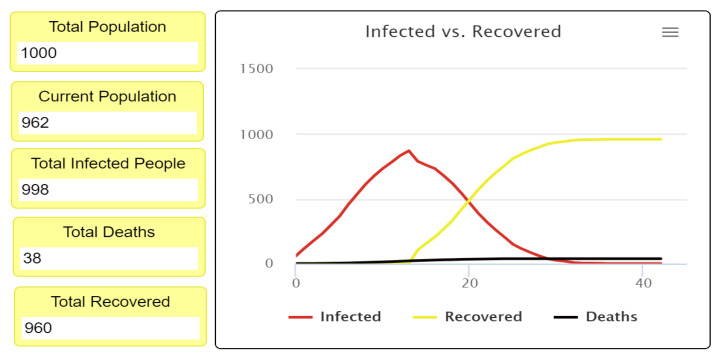
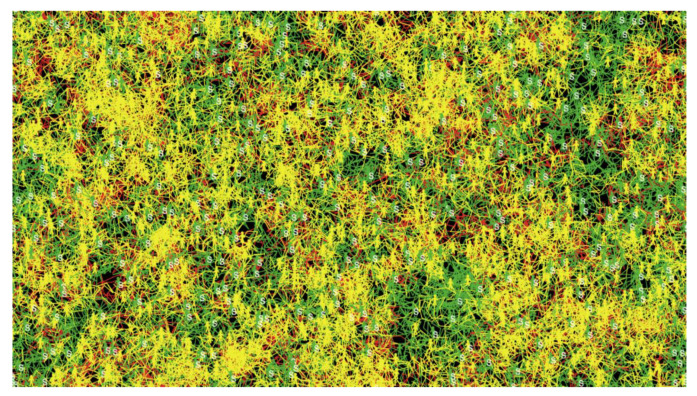
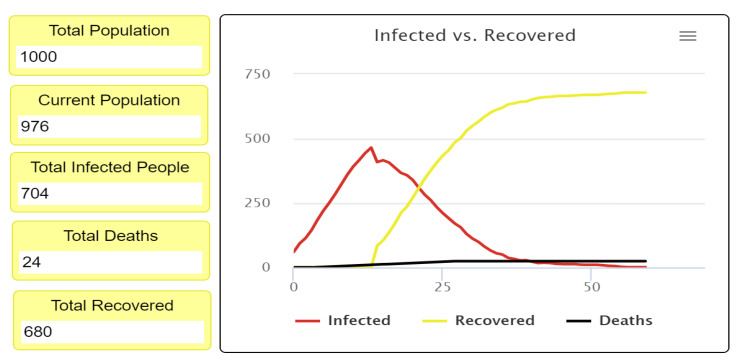
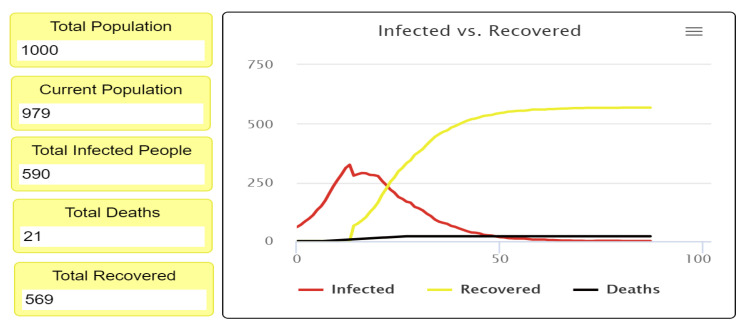
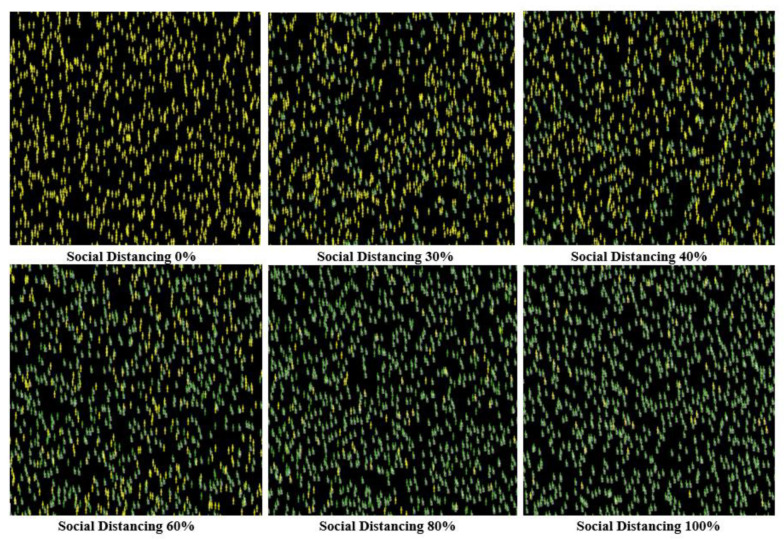
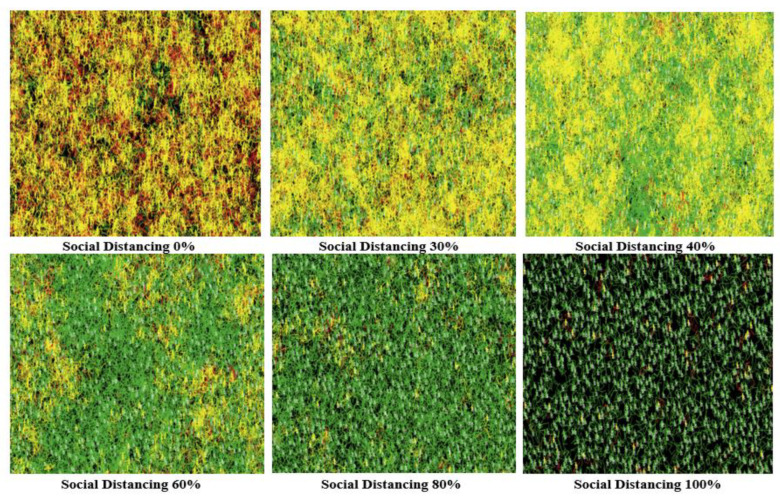
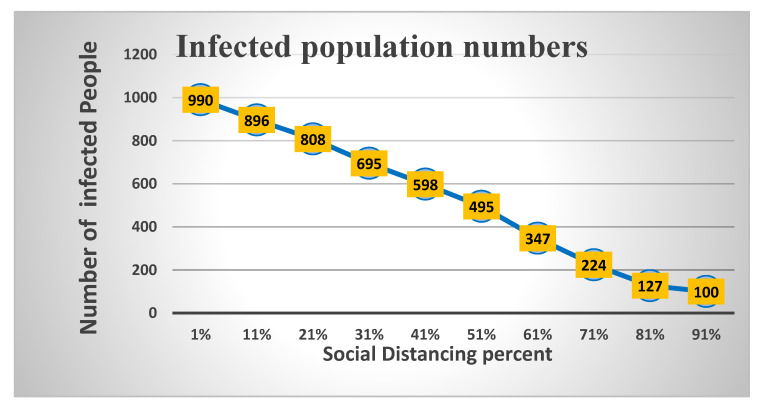
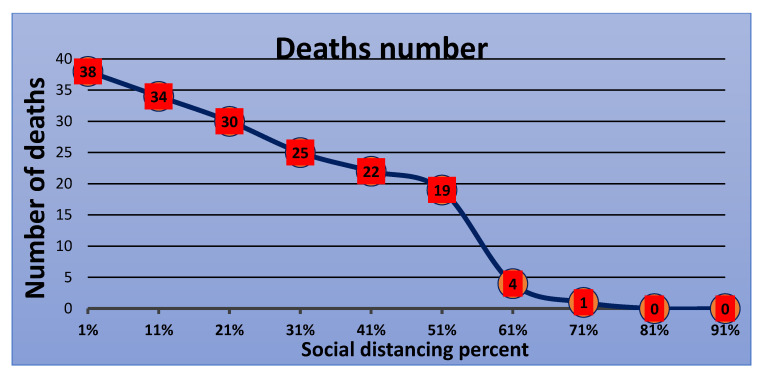
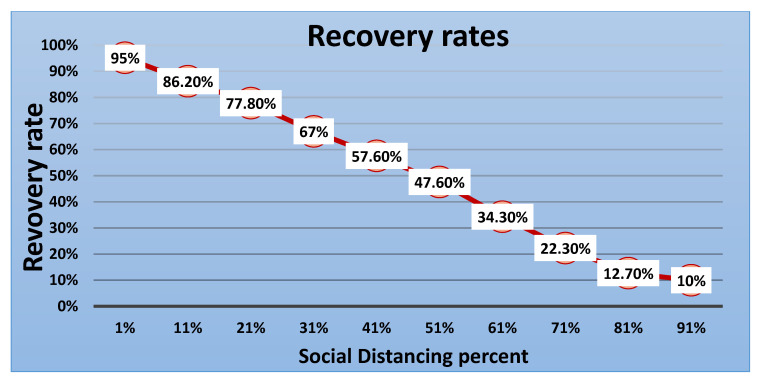
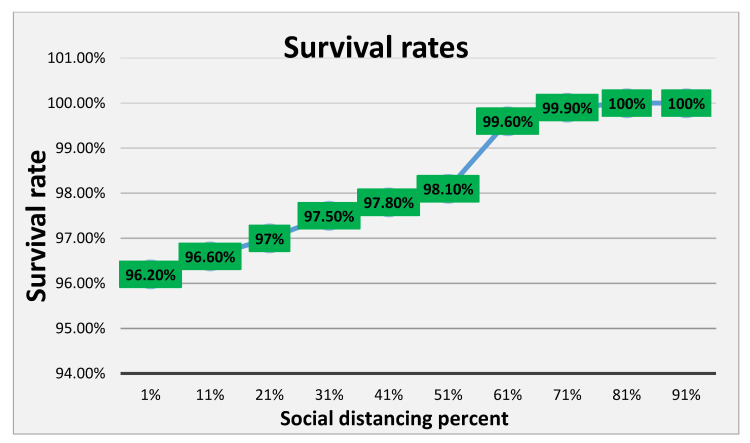
This paper studies the interplay between social distancing and the spread of the COVID-19 disease-a global pandemic that has affected most of the world's population. Our goals are to (1) to observe the correlation between the strictness of social distancing policies and the spread of disease and (2) to determine the optimal adoption level of social distancing policies. The earliest instances of the virus were found in China, and the virus has reached the United States with devastating consequences. Other countries severely affected by the pandemic are Brazil, Russia, the United Kingdom, Spain, India, Italy, and France. Although it is impossible to stop it, it is possible to slow down its spread to reduce its impact on the society and economy. Governments around the world have deployed various policies to reduce the virus spread in response to the pandemic. To assess the effectiveness of these policies, the system's dynamics of the society needs to be analyzed, which is generally not possible with mathematical linear equations or Monte Carlo methods because human society is a complex adaptive system with continuous feedback loops. Because of the challenges with the other methods, we chose agent-based methods to conduct our study. Moreover, recent agent-based modeling studies for the COVID-19 pandemic show significant promise in assisting decision-makers in managing the crisis by applying policies such as social distancing, disease testing, contact tracing, home isolation, emergency hospitalization, and travel prevention to reduce infection rates. Based on modeling studies conducted in Imperial College, increasing levels of interventions could slow the spread of disease and infection. We ran the model with six different percentages of social distancing while keeping the other parameters constant. The results show that social distancing affects the spread of COVID-19 significantly, in turn decreasing the spread of disease and infection rates when implemented at higher levels. We also validated these results by using the behavior space tool with ten experiments with varying social distancing levels. We conclude that applying and increasing social distancing policy levels leads to a significant reduction in infection spread and the number of deaths. Both experiments show that infection rates are reduced drastically when social distancing intervention is implemented between 80% to 100%.
Keywords: COVID-19; agent-based modeling; disease spread; social distancing.
Conflict of interest statement
The authors declare no conflict of interest.
Figures

References
-
- Centers for Disease Control and Prevention. [(accessed on 21 May 2021)];2020 Available online: https://www.cdc.gov/
-
- Pearce K. What is social distancing and how can it slow the spread of COVID-19. March. 2020;13:2020.
-
- China and Italy: Comparing the COVID-19 Response Timelines. CEIAS. [(accessed on 21 May 2021)];2020 May 24; Available online: https://ceias.eu/china-and-italy-comparing-the-covid-19-response-timelines/
-
- Erol S., Ordoñez G. Social and Economic Distancing. [(accessed on 21 May 2021)];2020 Available online: https://economics.sas.upenn.edu/sites/default/files/Paper%203%20SED_COVI....
MeSH terms
LinkOut - more resources
Full Text Sources
Medical
Miscellaneous
