. 2021 May 23;13(11):2561.
doi: 10.3390/cancers13112561.

Global Chromatin Changes Resulting from Single-Gene Inactivation-The Role of SMARCB1 in Malignant Rhabdoid Tumor

Affiliations

Global Chromatin Changes Resulting from Single-Gene Inactivation-The Role of SMARCB1 in Malignant Rhabdoid Tumor

Colin Kenny et al. Cancers (Basel). .

Abstract

Human cancer typically results from the stochastic accumulation of multiple oncogene-activating and tumor-suppressor gene-inactivating mutations. However, this process takes time and especially in the context of certain pediatric cancer, fewer but more 'impactful' mutations may in short order produce the full-blown cancer phenotype. This is well exemplified by the highly aggressive malignant rhabdoid tumor (MRT), where the only gene classically showing recurrent inactivation is SMARCB1, a subunit member of the BAF chromatin-remodeling complex. This is true of all three presentations of MRT including MRT of kidney (MRTK), MRT of the central nervous system (atypical teratoid rhabdoid tumor-ATRT) and extracranial, extrarenal rhabdoid tumor (EERT). Our reverse modeling of rhabdoid tumors with isogenic cell lines, either induced or not induced, to express SMARCB1 showed widespread differential chromatin remodeling indicative of altered BAF complex activity with ensuant histone modifications when tested by chromatin immunoprecipitation followed by sequencing (ChIP-seq). The changes due to reintroduction of SMARCB1 were preponderantly at typical enhancers with tandem BAF complex occupancy at these sites and related gene activation, as substantiated also by transcriptomic data. Indeed, for both MRTK and ATRT cells, there is evidence of an overlap between SMARCB1-dependent enhancer activation and tissue-specific lineage-determining genes. These genes are inactive in the tumor state, conceivably arresting the cells in a primitive/undifferentiated state. This epigenetic dysregulation from inactivation of a chromatin-remodeling complex subunit contributes to an improved understanding of the complex pathophysiological basis of MRT, one of the most lethal and aggressive human cancers.

Keywords: BAF; PBAF; SMARCB1; SWI/SNF; chromatin remodeling; lineage differentiation; ncBAF; rhabdoid tumors; tissue differentiation.


Conflict of interest statement

The authors declare no conflict of interest.

Figures
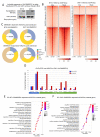
Figure 1
Figure 1
SMARCB1 re-expression leads to global gain of H3K27ac. (A) Western blot showing expression of HA-SMARCB1 in dox-treated cells only (Extended blots Figures S1 and S2). (B) Density heatmap illustrating 46761 H3K27ac peaks in mock- and doxycycline-treated BT16 cells and 52289 H3K27ac peaks in mock- and doxycycline-treated G401 cells obtained from anti-H3K27ac ChIP-seq. Using MACS2, peaks were grouped into SMARCB1-dependent H3K27ac peaks (n = 20,050 for BT16; n = 8944 for G401) and SMARCB1-independent H3K27ac peaks (n = 26,711 for BT16; n = 43,345 for G401). SMARCB1-dependent peaks were identified using a Log Likelihood Ratio (LRR) >2 for BT16 cells and LRR >1 in G401 cells (see methods). SMARCB1-independent H3K27ac peaks showed no H3K27ac signal difference with treatment and were therefore considered common to both treatment conditions. (C) Genomic peak distribution of combined SMARCB1-dependent and independent-H3K27ac peaks for each cell line individually are represented by donut plots, indicating most change at distal regulatory elements. (D) Chromatin immunoprecipitation qPCR analysis of H3K27ac at SMARCB1-independent peaks (blue underscore) and SMARCB1-dependent peaks (green underscore). Samples were normalized to input and plotted as the fold enrichment over IgG signal. Using ChIPSeeker (association rule, nearest gene within 100 Kb), genes were assigned to SMARCB1-dependent peaks and GO-analysis was performed using ClusterProfiler. (E) GO analysis of genes associated with the 20050 SMARCB1-dependent H3K27ac peaks identified in BT16 cells and (F) the 8944 SMARCB1-dependent H3K27ac peaks identified in G401. GO analysis is presented by dot plot; adjusted p-value is red lowest to blue highest; gene ratio is the ratio between genes associated with a SMARCB1-dependent H3K27ac peak and all genes in the GO category.
Figure 2
Figure 2
H3K27ac peaks gained in doxycycline-treated cells predominantly mark distal elements and a subset overlap with tissue-specific enhancers. (A,B) Density heatmaps of SMARCB1-activated enhancers that overlap H3K4me3 and/or H3K4me1, in order to further identify active promoters and enhancers, respectively, in BT16 (A) and G401 (B) cell lines. Samples are sorted based on doxycycline-treated H3K27ac signal and in descending order of signal strength. Differential analysis of gene expression between mock- and doxycycline-treated BT16 (C,D) and G401 (E,F) HA-SMARCB1-expressing cells using RNA-seq online datasets [23,24]. The log10-adjusted value versus the Log2 fold change of expression are plotted. Genes with gained SMARCB1-dependent enhancers and showing statistically significant differential expression (adj p-value < 0.05) are highlighted in red (upregulated) or blue (downregulated). The percentage of DEGs that associate with SMARCB1-dependent enhancers in BT16 and G401 cells are represented on the top of each volcano plot. (D,F) Box-plots representing the absolute log2 fold change of the up- (BT16, n = 694; G401, n = 805) and down-regulated (BT16, n = 59; G401, n = 445) genes with a gained SMARCB1-dependent enhancer from (A) or (B), center line, median; X, mean; box limits, upper and lower quartiles; whiskers, minimum and maximum values; dots, outliers. p-value according to the Wilcoxon’s rank sum test is shown. (G,H) Venn diagrams illustrating the overlap of SMARCB1-activated enhancers from BT16 cells and brain-specific enhancers (n = 122) (G) and overlap of SMARCB1-activated enhancers from G401 cells and kidney-specific enhancers (n = 146) (H) as identified from TiED (Tissue Enhancer Database). (I) Screenshot of IGV genome browser (GRCH37/hg19), three SMARCB1-dependent enhancers upstream the SMARCB1-activated gene GRP37L1 are shown (painted blue and labelled −66 Kb, −38 Kb and −15 Kb). Dark blue arrows indicate strand orientation and vertical rectangles the exons. Tracks, as labelled include Bed file of brain-specific enhancers (TiED), HA-SMARCB1 ChIP-seq for dox-treated BT16 cells (Black), H3K27ac (Rust) and H3K4me1 (Blue) ChIP-seq for mock- and dox-treated BT16 cells. Y axes are scaled per antibody sample. All three enhancers show gained HA-SMARCB1, H3K27ac and H3K4me1 in dox-treated cells. The +38 Kb enhancer overlaps a brain-specific enhancer (indicated with blue bar, top track).
Figure 3
Figure 3
Loss of SMARCB1 alters SWI/SNF binding at typical enhancers. (A) Venn diagram illustrating SWI/SNF, PBAF, and ncBAF binding events in mock- and doxycycline-treated cells. (B) Donut plots illustrating peak distribution of gained SWI/SNF, PBAF and ncBAF complexes in doxycycline treated BT16 and G401cell lines. (C,D) Density heatmaps of BAF complex binding, grouped according to BRG1 (core), SS18 (BAF), H3K27ac, H3K4me1, BAF180 (PBAF), ARID2 (PBAF) and BRD7 (PBAF) at the top-10% of activated H3K27ac elements in mock- and doxycycline-treated cells. Samples are sorted based on doxycycline-treated H3K27ac signal and in descending order of signal strength. (E) Screenshot of IGV genome browser at a region on chromosome 11. Three gained enhancers are shown (painted blue and labeled 1–3) with nearby genes CWC15 and KDM4D. Dark blue arrows indicate strand orientation and vertical rectangles the exons. Tracks, as labelled include H3K27ac ChIP-seq for normal kidney (in green) and HA-SMARCB1, BRG1, BAF170, SS18, BAF180, BRD7, H3K27Ac, H3K4Me1 and H3K4Me3 ChIP-seq for doxycycline- (in red) and mock-treated (in blue) G401 HA-SMARCB1 cell lines. Y axes are scaled per antibody sample. The first enhancer shows gained occupancy of SWI/SNF complex members, HA-SMARCB1, BRG1, BAF170 and SS18 in doxycycline-treated cells. The second gained enhancer overlaps a kidney-specific enhancer (indicated with purple bar) and shows gained occupancy of SWI/SNF in SMARCB1 re-expressing cells. The third gained enhancer also overlaps a kidney-specific enhancer. However, no binding of SWI/SNF was observed at this region. The level of H3K27ac and H3K4me3 ChIP-seq signal was unchanged at the promoters of both genes.
Figure 4
Figure 4
Characterization of BRD9 and BRG1 binding in mock-treated BT16 and G401 cell lines. (A) Donut plots BRD9 and BRG1 peaks in mock-treated G401 and BT16 cell lines were intersected using BEDtools and donut plots representing peak distribution were generated. (B) Density heatmap illustrating two groups (Top) 4934 BRD9 peaks without BRG1 binding and (Bottom) 28,516 BRD9 peaks with BRG1 binding in mock-treated BT16 cell lines. The heatmap is grouped according to BRD9, BRG1, H3K4me3 and BAF180. Samples are sorted based on BRD9 signal and in descending order of signal strength. (C) GREAT analysis of BRG1/BRD9 peaks in mock-treated BT16 and G401 cells. (D) Screenshot of IGV genome browser (GRCH37/hg19) showing positive ChIP-seq signal for BAF180, BRD9, BRG1, H3K27ac and H3K4me3 at the promoter region of CDK11A and CDK11B in BT16 and G401 cell lines. (E) Screenshot of IGV genome browser (GRCH37/hg19) showing positive ChIP-seq signal for BRD9, BRG1, H3K27ac and H3K4me3 at the promoter region of VEGFA and CCND1 in BT16 and G401 cell lines. Dark blue arrows indicate strand orientation and vertical rectangles the exons. Y axes are scaled per antibody sample. Normalization RPKM.
Figure 5
Figure 5
DNA methylation at promoters of developmental genes in rhabdoid tumors may provide additional/alternative means of repression of lineage differentiation (A) Scatterplot represents DNA methylation data from non-neoplastic kidney (NK; n = 3) and rhabdoid tumors of the kidney (MRTK; n = 3). Methylation signal intensities were converted to M-value by transferring the ratio of methylated vs. unmethylated signal to log2 scale. Probes with high M-value in MRTK samples and low M-value in NK samples are shown in Red (n = 523, >2 fold methylation in MRTK) and probes with low M-value in MRTK samples and high M-value in NK samples are shown in Blue (n = 642, >2 fold methylation in NK). Additional probes include tomato red (n = 569, >2 fold methylation in MRTK and <1 fold methylation in NK), cornflower blue (n = 961, >2 fold methylation in NK and <1 fold methylation in MRTK) and orange (n = 4036, >2 fold methylation in both MRTK and NK). Each probe was assigned to its nearest gene ±5 Kb and publicly available RNA-seq datasets from six MRTK and matched normal kidney samples were used to determine the expression levels of genes with hypermethylated promoters specific to MRTK tumors compared to normal kidney. Genes with MRTK hypermethylated promoters (associated with 523 probes) (B) and 100 randomly selected genes (C), red = MRTK samples, blue = NK samples, y-axis log10 normalized reads. (D,E) Genes whose promoter CpG islands showed methylation specific to MRTK were significantly associated with developmental programs and cell adhesion whereas promoter CpGs showing methylation in normal kidney were associated with silencing of epidermal cell differentiation, skin development and innate immune response. A full list of probes with M-values for MRTK and NK can be found in Tables S3 and S4. Publicly available Methylation and RNA-seq datasets from [33,34].

Similar articles

Cited by

References

    1. Hanahan D., Weinberg R.A. The Hallmarks of Cancer. Cell. 2000;100:57–70. doi: 10.1016/S0092-8674(00)81683-9. - DOI - PubMed
    1. Hanahan D., Weinberg R.A. Hallmarks of Cancer: The Next Generation. Cell. 2011;144:646–674. doi: 10.1016/j.cell.2011.02.013. - DOI - PubMed
    1. Versteege I., Sévenet N., Lange J., Rousseau-Merck M.-F., Ambros P., Handgretinger R., Aurias A., Delattre O. Truncating mutations of hSNF5/INI1 in aggressive paediatric cancer. Nat. Cell Biol. 1998;394:203–206. doi: 10.1038/28212. - DOI - PubMed
    1. Biegel J.A., Zhou J.Y., Rorke L.B., Stenstrom C., Wainwright L.M., Fogelgren B. Germ-line and acquired mutations of INI1 in atyp-ical teratoid and rhabdoid tumors. Cancer Res. 1999;59:74–79. - PubMed
    1. Hasselblatt M., Gesk S., Oyen F., Rossi S., Viscardi E., Giangaspero F., Giannini C., Judkins A.R., Frühwald M.C., Obser T., et al. Nonsense Mutation and Inactivation of SMARCA4 (BRG1) in an Atypical Teratoid/Rhabdoid Tumor Showing Retained SMARCB1 (INI1) Expression. Am. J. Surg. Pathol. 2011;35:933–935. doi: 10.1097/PAS.0b013e3182196a39. - DOI - PubMed