

Association between the Area of the Highest Flank Temperature and Concentrations of Reproductive Hormones during Pregnancy in Polish Konik Horses-A Preliminary Study
- PMID: 34071111
- PMCID: PMC8224734
- DOI: 10.3390/ani11061517
Association between the Area of the Highest Flank Temperature and Concentrations of Reproductive Hormones during Pregnancy in Polish Konik Horses-A Preliminary Study
Abstract
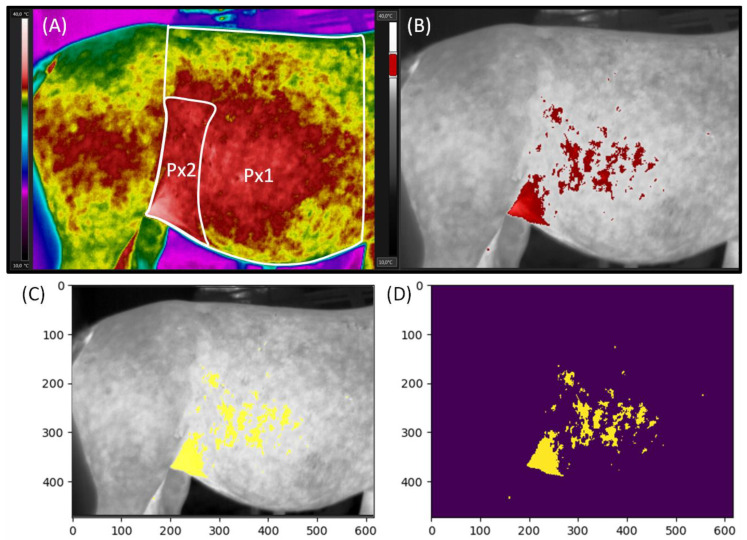
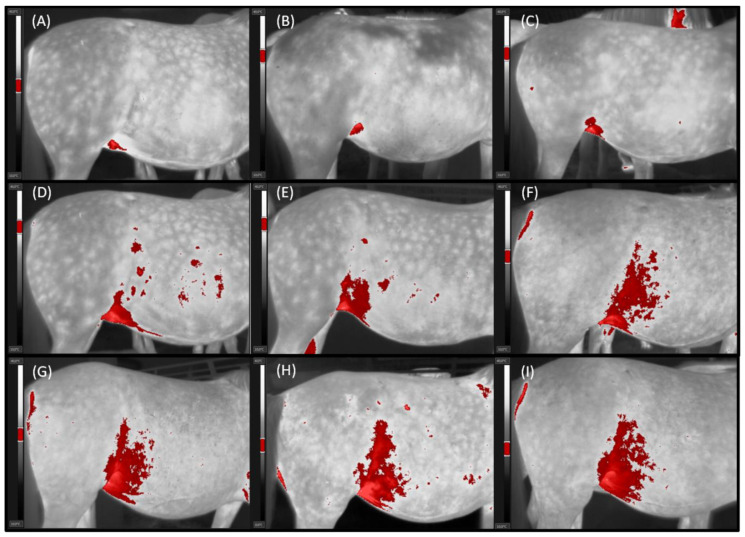
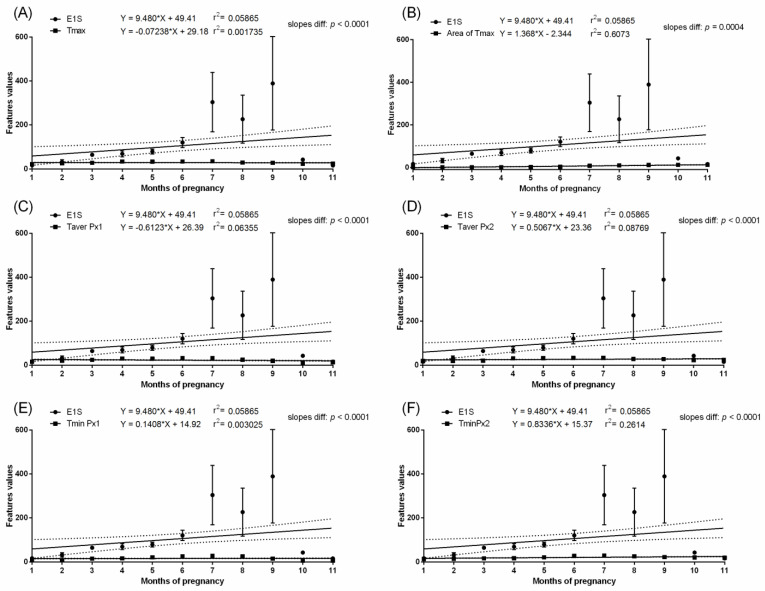
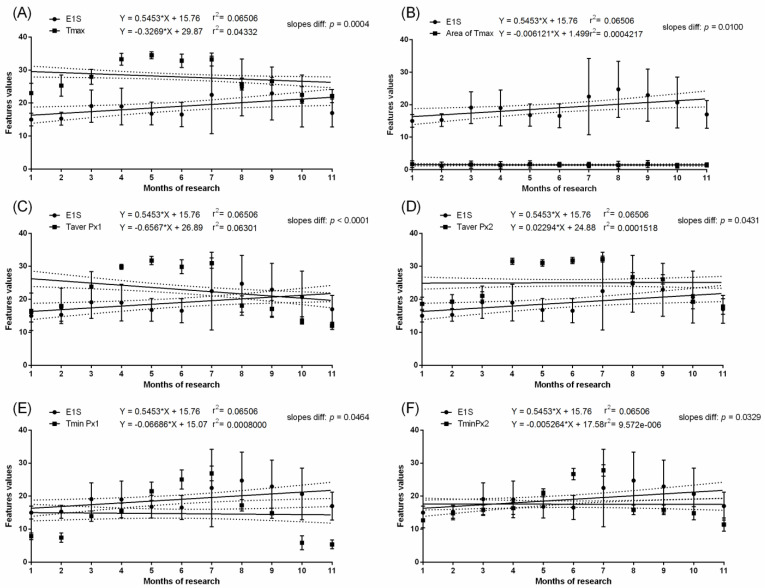
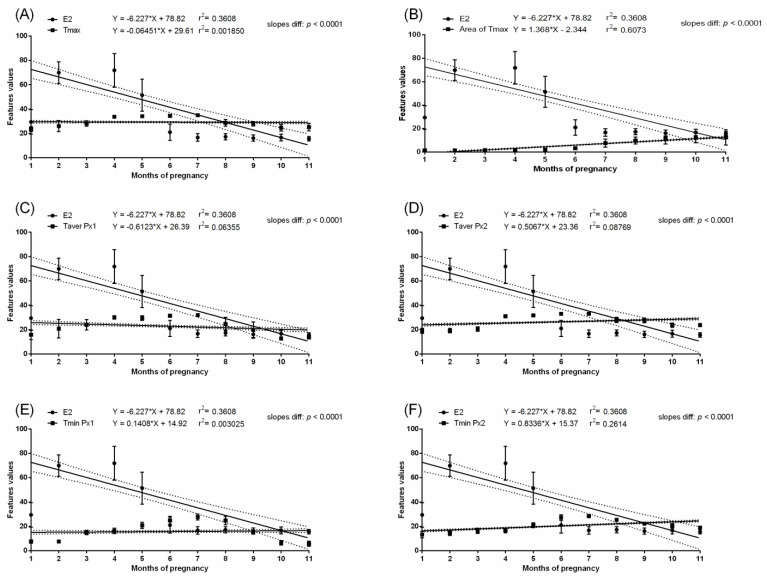
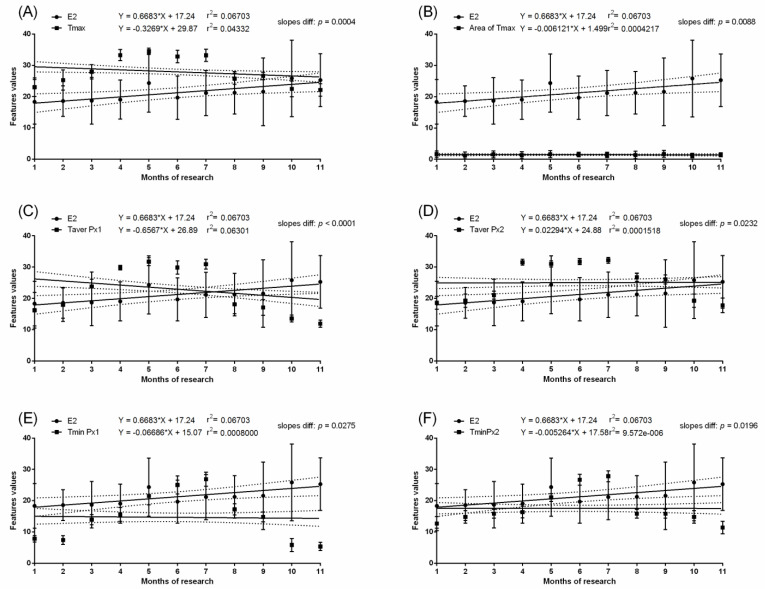
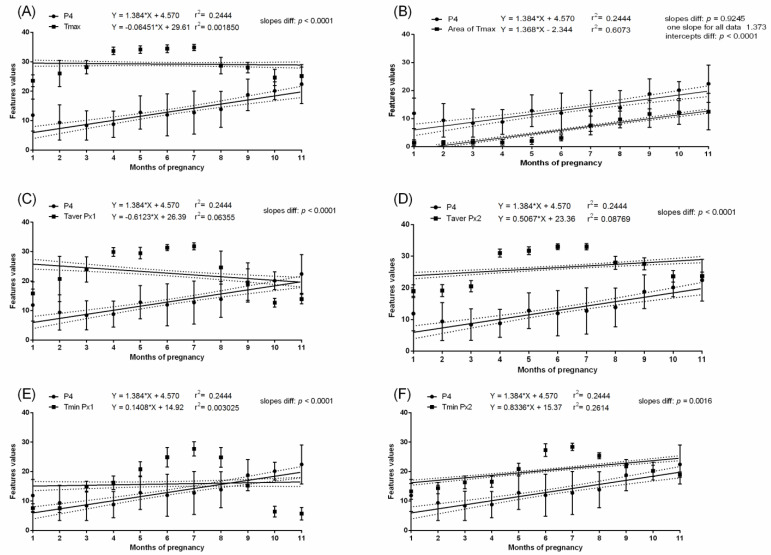
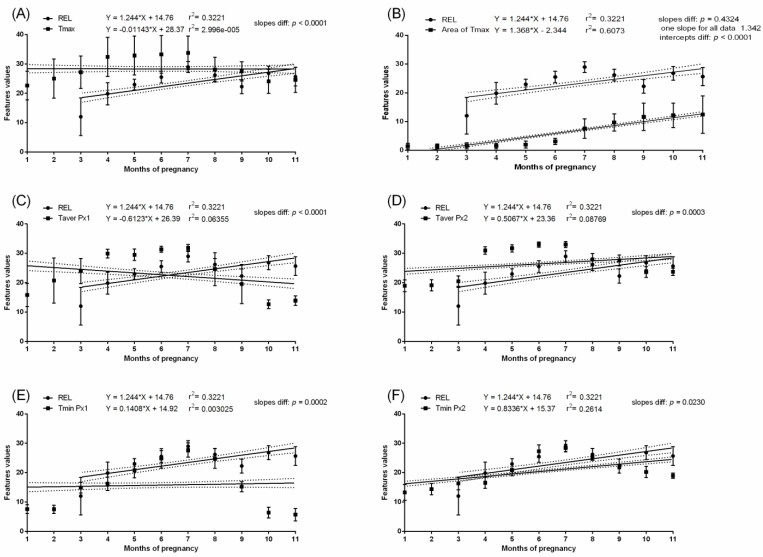
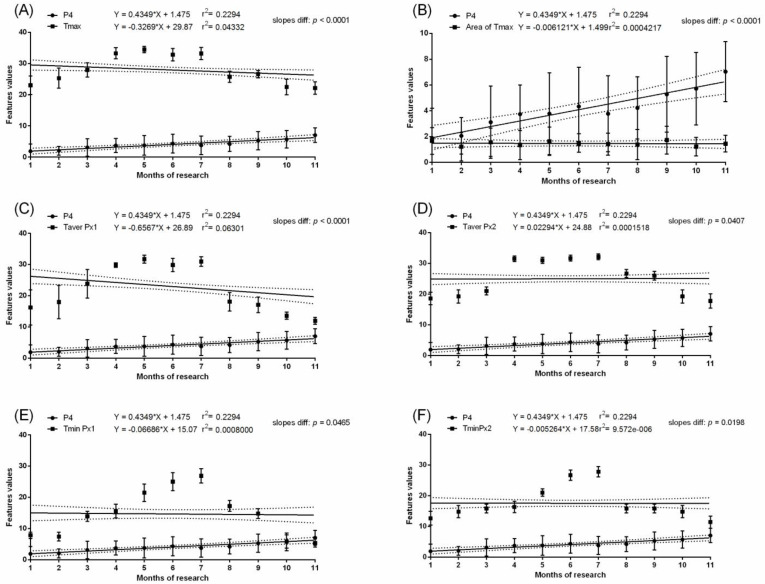
Determination of the pregnancy status is one of the most important factors for effective pregnancy management. Knowledge of the stage of pregnancy is important to interpret many of the reproductive hormones' concentrations, including progesterone (P4), estrone sulfate (E1S), 17-ß estradiol (E2), and relaxin (REL). However, it is limited in wildlife or captive equids that cannot be handled. Reproductive hormones affect regional blood flow, the proliferation of tissues, and local metabolism intensity. Therefore, this preliminary study aimed to assess changes in thermal features of the abdomen lateral surface and concentrations of reproductive hormones in Polish native pregnant mares. The study was carried out on 14 non-pregnant and 26 pregnant Polish Konik mares during eleven months of pregnancy. Infrared thermography was conducted to image the lateral surface of mares' abdomen (Px1) and flank area (Px2); P4, E1S, E2, and REL concentrations in serum were also determined. The evidence of the association between the area with the highest temperatures (Area of Tmax) and serum concentrations of P4 (the slope = 1.373; p = 0.9245) and REL (the slope = 1.342; p = 0.4324) were noted dependent across months of pregnancy. Measures of superficial body temperatures were found to change monthly, similarly to ambient temperatures, with no evidence of coincidence with changes in reproductive hormone concentrations. Individual thermal characteristics of the lateral surface of the abdomen differed between pregnant and non-pregnant mares in other periods. Differences in maximal and average temperature and Area of Tmax were observed from the sixth month of pregnancy, and those in minimal temperature were observed from the eighth month.
Keywords: Konik Polski; estrogens; gestation; progesterone; relaxin; thermography.
Conflict of interest statement
The authors declare no conflict of interest.
Figures
Similar articles
-
Thermal features, ambient temperature and hair coat lengths: Limitations of infrared imaging in pregnant primitive breed mares within a year.Reprod Domest Anim. 2021 Oct;56(10):1315-1328. doi: 10.1111/rda.13994. Epub 2021 Aug 16. Reprod Domest Anim. 2021. PMID: 34310786 Free PMC article.
-
Plasma relaxin, estrogens and progestogens concentration in coldblooded and hot-blood mares in the second half of gestation.J Equine Vet Sci. 2024 Mar;134:105017. doi: 10.1016/j.jevs.2024.105017. Epub 2024 Feb 2. J Equine Vet Sci. 2024. PMID: 38309541
-
Evolution of 17-β-estradiol, estrone and estrone-sulfate concentrations in late pregnancy of different breeds of mares using Liquid Chromatography and Mass Spectrometry.Theriogenology. 2022 Sep 1;189:86-91. doi: 10.1016/j.theriogenology.2022.06.004. Epub 2022 Jun 11. Theriogenology. 2022. PMID: 35738034
-
Assessment of pregnancy in the late-gestation mare using digital infrared thermography.Theriogenology. 2009 Aug;72(3):372-7. doi: 10.1016/j.theriogenology.2009.03.005. Epub 2009 May 30. Theriogenology. 2009. PMID: 19482351
-
Ultrastructural and histological characteristics of the endometrium during early embryo development in mares.Theriogenology. 2019 Jan 1;123:1-10. doi: 10.1016/j.theriogenology.2018.09.018. Epub 2018 Sep 18. Theriogenology. 2019. PMID: 30253251 Review.
Cited by
-
Thermal features, ambient temperature and hair coat lengths: Limitations of infrared imaging in pregnant primitive breed mares within a year.Reprod Domest Anim. 2021 Oct;56(10):1315-1328. doi: 10.1111/rda.13994. Epub 2021 Aug 16. Reprod Domest Anim. 2021. PMID: 34310786 Free PMC article.
-
Selection of Image Texture Analysis and Color Model in the Advanced Image Processing of Thermal Images of Horses following Exercise.Animals (Basel). 2022 Feb 12;12(4):444. doi: 10.3390/ani12040444. Animals (Basel). 2022. PMID: 35203152 Free PMC article.
-
Beyond the Camera Trap: A Systematic Review of Computing Technology Used to Monitor and Interact with (More) Varied Taxa in Zoos and Aquariums.Animals (Basel). 2025 Jun 11;15(12):1721. doi: 10.3390/ani15121721. Animals (Basel). 2025. PMID: 40564273 Free PMC article. Review.
-
Advances in Thermal Image Analysis for the Detection of Pregnancy in Horses Using Infrared Thermography.Sensors (Basel). 2021 Dec 28;22(1):191. doi: 10.3390/s22010191. Sensors (Basel). 2021. PMID: 35009733 Free PMC article.
-
Comparison of Fecal Microbiota Communities between Primiparous and Multiparous Cows during Non-Pregnancy and Pregnancy.Animals (Basel). 2023 Feb 27;13(5):869. doi: 10.3390/ani13050869. Animals (Basel). 2023. PMID: 36899725 Free PMC article.
References
-
- Cilulko J., Janiszewski P., Bogdaszewski M., Szczygielska E. Infrared thermal imaging in studies of wild animals. Eur. J. Wildl. Res. 2013;59:17–23. doi: 10.1007/s10344-012-0688-1. - DOI
-
- Roberto J.V.B., De Souza B.B. Use of infrared thermography in veterinary medicine and animal production. J. Anim. Behav. Biometeorol. 2020;2:73–84. doi: 10.14269/2318-1265/jabb.v2n3p73-84. - DOI
-
- Soroko M., Howell K. Infrared thermography: Current applications in equine medicine. J. Equine Vet. Sci. 2018;60:90–96. doi: 10.1016/j.jevs.2016.11.002. - DOI
Grants and funding
LinkOut - more resources
Full Text Sources
