. 2021 May 28;10(6):869.
doi: 10.3390/antiox10060869.

The Overactivation of NADPH Oxidase during Clonorchis sinensis Infection and the Exposure to N-Nitroso Compounds Promote Periductal Fibrosis

Affiliations

The Overactivation of NADPH Oxidase during Clonorchis sinensis Infection and the Exposure to N-Nitroso Compounds Promote Periductal Fibrosis

Ji Hoon Jeong et al. Antioxidants (Basel). .

Abstract

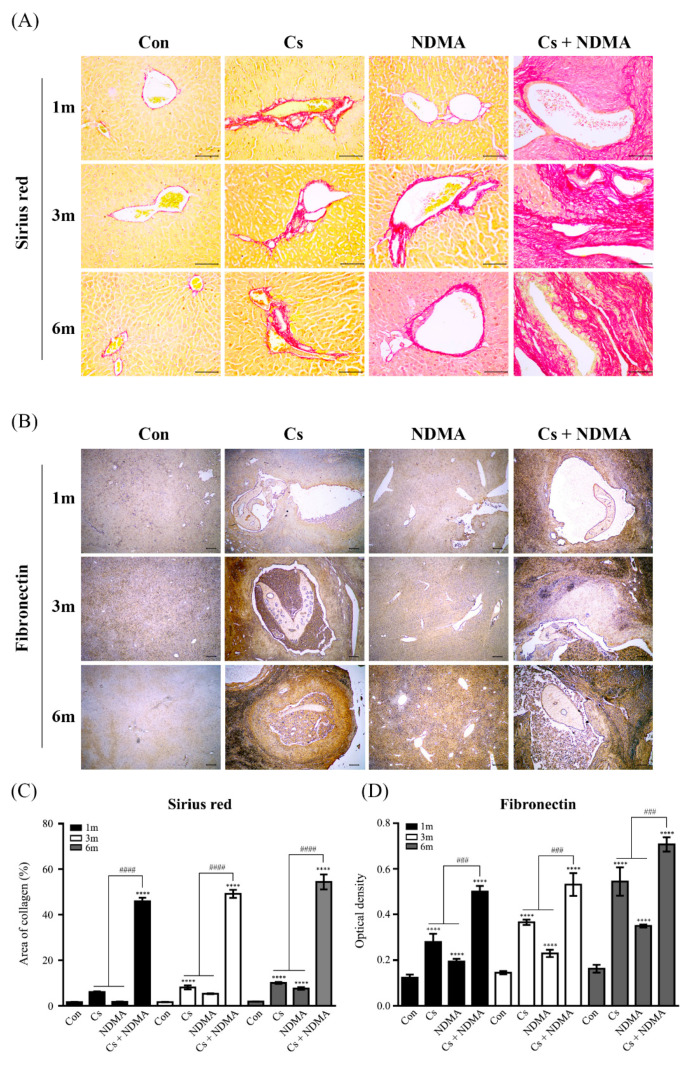
Clonorchis sinensis, a high-risk pathogenic human liver fluke, provokes various hepatobiliary complications, including epithelial hyperplasia, inflammation, periductal fibrosis, and even cholangiocarcinogenesis via direct contact with worms and their excretory-secretory products (ESPs). These pathological changes are strongly associated with persistent increases in free radical accumulation, leading to oxidative stress-mediated lesions. The present study investigated C. sinensis infection- and/or carcinogen N-nitrosodimethylamine (NDMA)-associated fibrosis in cell culture and animal models. The treatment of human cholangiocytes (H69 cells) with ESPs or/and NDMA increased reactive oxidative species (ROS) generation via the activation of NADPH oxidase (NOX), resulting in augmented expression of fibrosis-related proteins. These increased expressions were markedly attenuated by preincubation with a NOX inhibitor (diphenyleneiodonium chloride) or an antioxidant (N-acetylcysteine), indicating the involvement of excessive NOX-dependent ROS formation in periductal fibrosis. The immunoreactive NOX subunits, p47phox and p67phox, were observed in the livers of mice infected with C. sinensis and both infection plus NDMA, concomitant with collagen deposition and immunoreactive fibronectin elevation. Staining intensities are proportional to lesion severity and infection duration or/and NDMA administration. Thus, excessive ROS formation via NOX overactivation is a detrimental factor for fibrogenesis during liver fluke infection and exposure to N-nitroso compounds.

Keywords: Clonorchis sinensis infection; N-nitrosodimethylamine; NADPH oxidases; cholangiocarcinoma; cholangiocytes; excretory-secretory products; oxidative stress; periductal fibrosis.


Conflict of interest statement

The authors declare no conflict of interest in relation to this study.

Figures

Figure 1
Figure 1
Effect of ESPs or/and NDMA on NOX activation, ROS generation, and fibrosis-related protein expression. Cells were treated with 1.6 μg/mL ESPs, 8 μg/mL NDMA, or both for 24 h and harvested for immunoblot and DCF analyses. (A) Representative immunoblot showing the accumulation of the NOX subunits (p47phox and p67phox) in the membrane fractions. Individual bands were quantified densitometrically and normalized to calnexin. Values are presented as means ± SE for three independent experiments. *, # p < 0.05, *; compared with the untreated control, #; ESPs- or NDMA-treated group versus ESP and NDMA-treated group. (B) Intracellular ROS levels were measured by CM-H2DCFDA fluorescence with a spectrofluorometer. Each data set represents the mean ± SE (n = four independent experiments) expressed as a fold change of untreated control value. *, # p < 0.05, *; compared with the untreated control, #; ESP- or NDMA-treated group versus ESP and NDMA-treated group. (C) Representative immunoblot showing fibrosis-related proteins in cytosolic fractions. Protein bands were quantified using densitometry, and their abundances were normalized according to GAPDH expression. Each data set represents the means ± SE (n = three independent experiments). *, # p < 0.05, *** p < 0.001, *; compared with the untreated control, #; ESP- or NDMA-treated group versus ESPs and NDMA-treated group. C; untreated control, E; ESP-treated, N; NDMA-treated, E + N; ESPs and NDMA-treated.
Figure 2
Figure 2
Inhibitory effect of NOX inhibitor on ESPs and/or NDMA-induced NOX activation, ROS generation, and fibrosis-related protein expression. Cells were pretreated with 20 μM DPI or 0.01% DMSO (vehicle only; untreated) for 1 h and then treated with ESPs, NDMA, or ESPs plus NDMA for 24 h. (A) Membrane proteins were immunoblotted for p47phox and p67phox. Calnexin was used as a protein loading control. *, # p < 0.05, *; compared with the untreated control, #; vehicle only versus DPI-treated group. (B) The effect of DPI pretreatment on ROS generation triggered by ESPs and/or NDMA. Each data set represents the means ± SE (n = four independent experiments) expressed as a fold change of untreated control. *, # p < 0.05, *; compared with the untreated control, #; vehicle only versus DPI-treated group. (C) Expression of fibrosis-related proteins. GAPDH was used as a loading control for normalization. Data in graphs in (A,C)a re expressed as means ± SE (n = three independent experiments). *, # p < 0.05, *; compared with the untreated control, #; vehicle only versus DPI-treated group.
Figure 3
Figure 3
Effects of NAC on ESPs and/or NDMA-induced NOX activation, ROS generation, and fibrosis-related protein expression. Cells were pretreated with 1 mM NAC or an equal volume of H2O (untreated) for 1 h, followed by the treatment with ESPs, NDMA, or ESPs plus NDMA for 24 h. (A) The levels of ROS determined by DCF fluorescence. Each data set represents the means ± SE (n = four independent experiments), expressed as a fold change of control values. *, # p < 0.05, *; compared with the untreated control, #; vehicle only versus NAC-treated group. (B) Representative immunoblots for membranous p47phox and p67phox expression. (C) The inhibitory effect of NAC on ESPs and/or NDMA-induced fibrosis-related protein expression. Individual bands were quantified densitometrically and normalized to calnexin and GAPDH as loading controls for membrane (B) and cytosolic (C) proteins. The values in graphs in B and C are represented as fold changes relative to the control expressed as means ± SE (n = three independent experiments). *, # p < 0.05, *; compared with the untreated control, #; vehicle only versus NAC-treated group, n.s; not significant.
Figure 4
Figure 4
Time course of p47phox and p67phox immunoreactivity in the livers of Con (uninfected control), Cs (C. sinensis infected), NDMA (NDMA administered), and Cs plus NDMA (C. sinensis-infected and NDMA-administered) mice. Three independent liver sections from each group for three infection time points were immunostained with p47phox or p67phox, and representative images for each group are shown in (A,B), respectively. p47phox and p67phox expression was marked with brown deposits and nuclei were counterstained with hematoxylin (blue). Scale bar = 200 μm; original magnification, ×40. (C,D) The intensities of dark brown dots in (A,B) images were quantified using an Image J program. Each data set in the graph is expressed as means ± SE. # p < 0.05, ***, ### p < 0.001, **** p < 0.0001, compared with the control group, #; Cs or NDMA group versus Cs plus NDMA group. Cs, C. sinensis worm; D, ductal dilatation; F, Fibrosis; H, hyperplasia region; I, inflammatory region.
Figure 5
Figure 5
Time profiles of collagen and fibronectin expression in the livers of mice from 4 groups (Con, Cs, NDMA, Cs plus NDMA). Three independent liver sections from each group for three infection time points were stained with Sirius red for collagen types I and III fibers or immunostained with polyclonal antibody to fibronectin, and representative images for each group are shown in (A,B), respectively. Collagen fiber deposition is presented in red. Brown represents the expression of fibronectin and blue for counterstained nuclei with hematoxylin. (A) Scale bar = 100 μm. Original magnification, ×200. (B) Scale bar = 200 μm; original magnification ×40. (C) Quantification of the Sirius red staining area using an Image J program. (D) The intensities of dark brown dots in the B image were quantified using an Image J program. Data in the graph are expressed as means ± SE. ### p < 0.001, ****, #### p < 0.0001, *; compared with the control group, #; Cs or NDMA group versus Cs plus NDMA group.

Similar articles

Cited by

References

    1. Jadeja R.N., Devkar R.V., Nammi S. Oxidative Stress in Liver Diseases: Pathogenesis, Prevention, and Therapeutics. Oxid. Med. Cell Longev. 2017;2017:8341286. doi: 10.1155/2017/8341286. - DOI - PMC - PubMed
    1. Crosas-Molist E., Fabregat I. Role of NADPH oxidases in the redox biology of liver fibrosis. Redox Biol. 2015;6:106–111. doi: 10.1016/j.redox.2015.07.005. - DOI - PMC - PubMed
    1. Choi M.S., Choi D., Choi M.H., Ji Z., Li Z., Cho S.Y., Hong K.S., Rim H.J., Hong S.T. Correlation between sonographic findings and infection intensity in clonorchiasis. Am. J. Trop. Med. Hyg. 2005;73:1139–1144. doi: 10.4269/ajtmh.2005.73.1139. - DOI - PubMed
    1. Kim T.S., Pak J.H., Kim J.B., Bahk Y.Y. Clonorchis sinensis, an oriental liver fluke, as a human biological agent of cholangiocarcinoma: A brief review. BMB Rep. 2016;49:590–597. doi: 10.5483/BMBRep.2016.49.11.109. - DOI - PMC - PubMed
    1. Na B.K., Pak J.H., Hong S.J. Clonorchis sinensis and clonorchiasis. Acta Trop. 2020;203:105309. doi: 10.1016/j.actatropica.2019.105309. - DOI - PubMed

LinkOut - more resources