

Correlating qRT-PCR, dPCR and Viral Titration for the Identification and Quantification of SARS-CoV-2: A New Approach for Infection Management
- PMID: 34071726
- PMCID: PMC8229388
- DOI: 10.3390/v13061022
Correlating qRT-PCR, dPCR and Viral Titration for the Identification and Quantification of SARS-CoV-2: A New Approach for Infection Management
Abstract
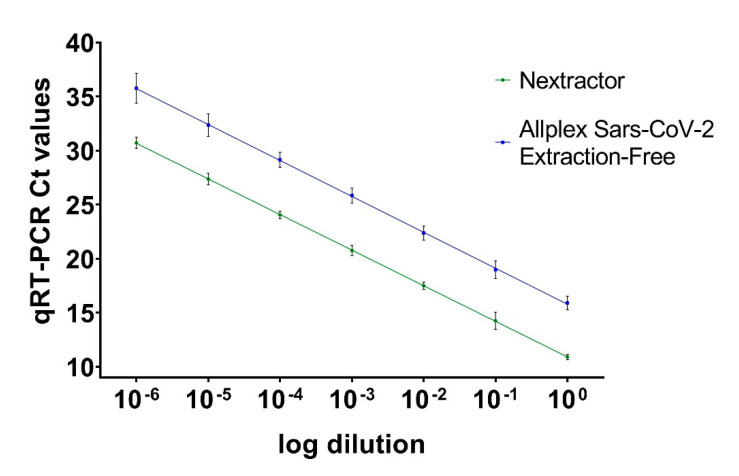
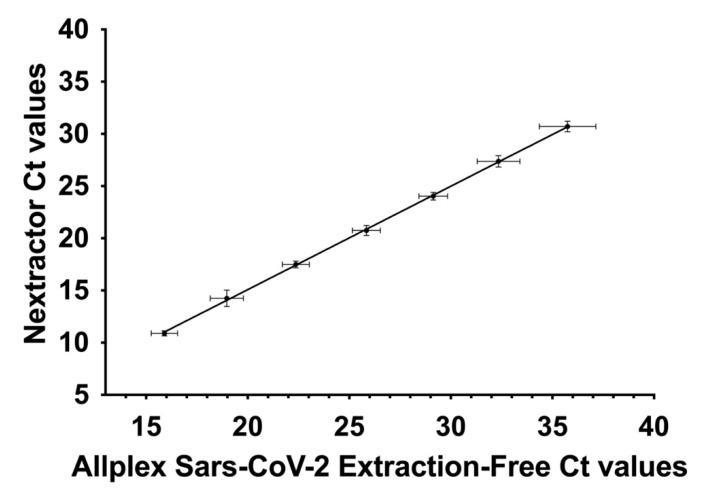
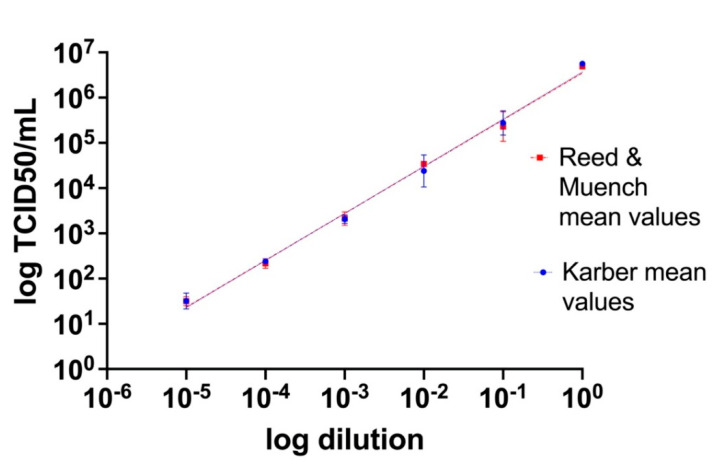
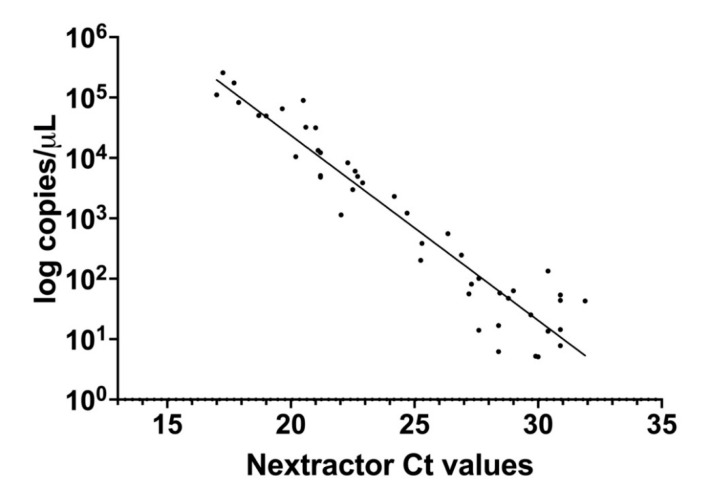
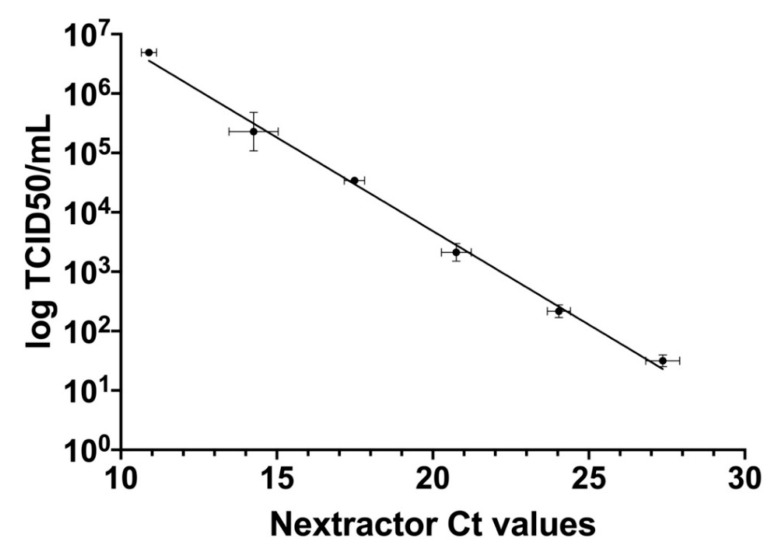
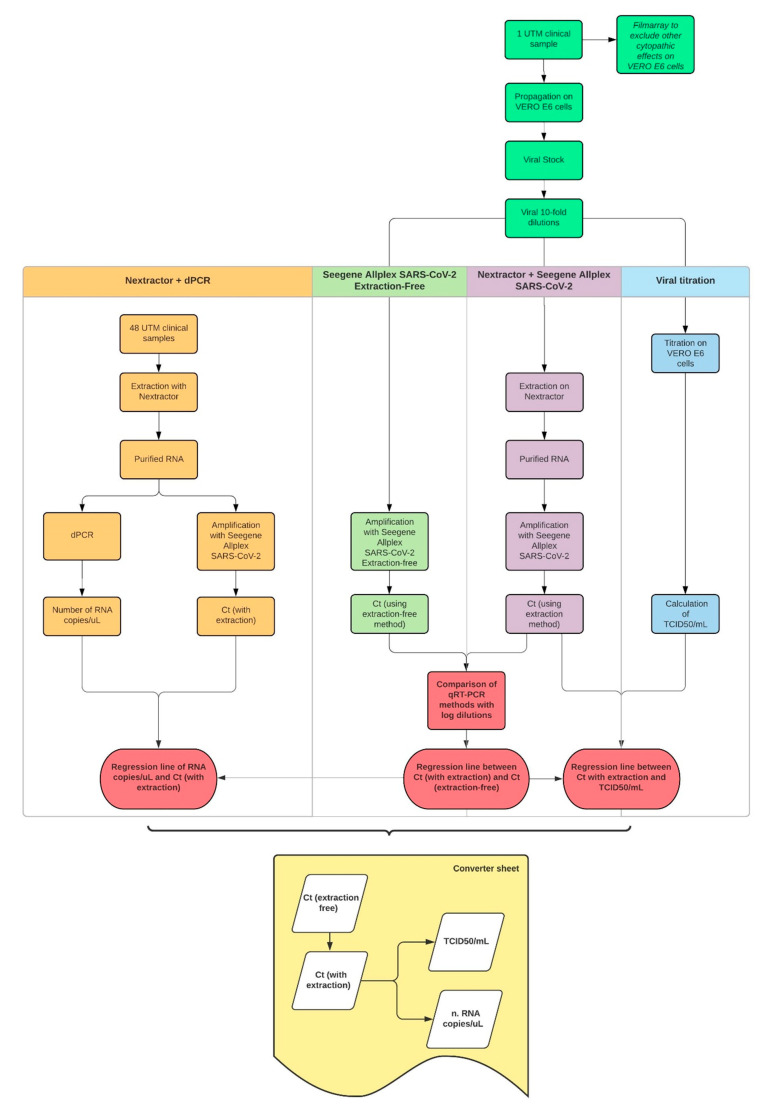
Severe acute respiratory syndrome coronavirus 2 (SARS-CoV-2) was first identified in Wuhan, China, in late 2019 and is the causative agent of the coronavirus disease 2019 (COVID-19) pandemic. Quantitative reverse-transcription polymerase chain reaction (qRT-PCR) represents the gold standard for diagnostic assays even if it cannot precisely quantify viral RNA copies. Thus, we decided to compare qRT-PCR with digital polymerase chain reaction (dPCR), which is able to give an accurate number of RNA copies that can be found in a specimen. However, the aforementioned methods are not capable to discriminate if the detected RNA is infectious or not. For this purpose, it is necessary to perform an endpoint titration on cell cultures, which is largely used in the research field and provides a tissue culture infecting dose per mL (TCID50/mL) value. Both research and diagnostics call for a model that allows the comparison between the results obtained employing different analytical methods. The aim of this study is to define a comparison among two qRT-PCR protocols (one with preliminary RNA extraction and purification and an extraction-free qRT-PCR), a dPCR and a titration on cell cultures. The resulting correlations yield a faithful estimation of the total number of RNA copies and of the infectious viral burden from a Ct value obtained with diagnostic routine tests. All these estimations take into consideration methodological errors linked to the qRT-PCR, dPCR and titration assays.
Keywords: COVID-19; Ct; RNA copies; SARS-CoV-2; TCID50/mL; dPCR; qRT-PCR; viral titration.
Conflict of interest statement
M.E.T. is a member of Xenturion Srl. The authors declare no conflict of interest.
Figures
Similar articles
-
An in vitro model for assessment of SARS-CoV-2 infectivity by defining the correlation between virus isolation and quantitative PCR value: isolation success of SARS-CoV-2 from oropharyngeal swabs correlates negatively with Cq value.Virol J. 2021 Apr 7;18(1):71. doi: 10.1186/s12985-021-01542-y. Virol J. 2021. PMID: 33827618 Free PMC article.
-
Interlaboratory assessment of quantification of SARS-CoV-2 RNA by reverse transcription digital PCR.Anal Bioanal Chem. 2021 Dec;413(29):7195-7204. doi: 10.1007/s00216-021-03680-2. Epub 2021 Oct 26. Anal Bioanal Chem. 2021. PMID: 34697653 Free PMC article.
-
Analysis and validation of a highly sensitive one-step nested quantitative real-time polymerase chain reaction assay for specific detection of severe acute respiratory syndrome coronavirus 2.Virol J. 2020 Dec 28;17(1):197. doi: 10.1186/s12985-020-01467-y. Virol J. 2020. PMID: 33371898 Free PMC article.
-
Digital PCR in Virology: Current Applications and Future Perspectives.Mol Diagn Ther. 2025 Jan;29(1):43-54. doi: 10.1007/s40291-024-00751-9. Epub 2024 Nov 2. Mol Diagn Ther. 2025. PMID: 39487879 Review.
-
Assessment of Air Contamination by SARS-CoV-2 in Hospital Settings.JAMA Netw Open. 2020 Dec 1;3(12):e2033232. doi: 10.1001/jamanetworkopen.2020.33232. JAMA Netw Open. 2020. PMID: 33355679 Free PMC article.
Cited by
-
Identification of Cellular Factors Required for SARS-CoV-2 Replication.Cells. 2021 Nov 13;10(11):3159. doi: 10.3390/cells10113159. Cells. 2021. PMID: 34831382 Free PMC article.
-
Cationic Surfactants as Disinfectants against SARS-CoV-2.Int J Mol Sci. 2022 Jun 14;23(12):6645. doi: 10.3390/ijms23126645. Int J Mol Sci. 2022. PMID: 35743090 Free PMC article.
-
SARS-CoV-2 Omicron variant causes mild pathology in the upper and lower respiratory tract of hamsters.Nat Commun. 2022 Jun 20;13(1):3519. doi: 10.1038/s41467-022-31200-y. Nat Commun. 2022. PMID: 35725735 Free PMC article.
-
Subgenomic RNA Detection in SARS-CoV-2 Assessing Replication and Inactivation Through Serial Passages, RT-qPCR, and Electron Microscopy.Int J Mol Sci. 2025 Feb 1;26(3):1281. doi: 10.3390/ijms26031281. Int J Mol Sci. 2025. PMID: 39941049 Free PMC article.
-
Virucidal Coatings Active Against SARS-CoV-2.Molecules. 2024 Oct 20;29(20):4961. doi: 10.3390/molecules29204961. Molecules. 2024. PMID: 39459329 Free PMC article.
References
Publication types
MeSH terms
Substances
LinkOut - more resources
Full Text Sources
Medical
Miscellaneous
