

Impact of 4th of July Fireworks on Spatiotemporal PM2.5 Concentrations in California Based on the PurpleAir Sensor Network: Implications for Policy and Environmental Justice
- PMID: 34071796
- PMCID: PMC8198140
- DOI: 10.3390/ijerph18115735
Impact of 4th of July Fireworks on Spatiotemporal PM2.5 Concentrations in California Based on the PurpleAir Sensor Network: Implications for Policy and Environmental Justice
Abstract
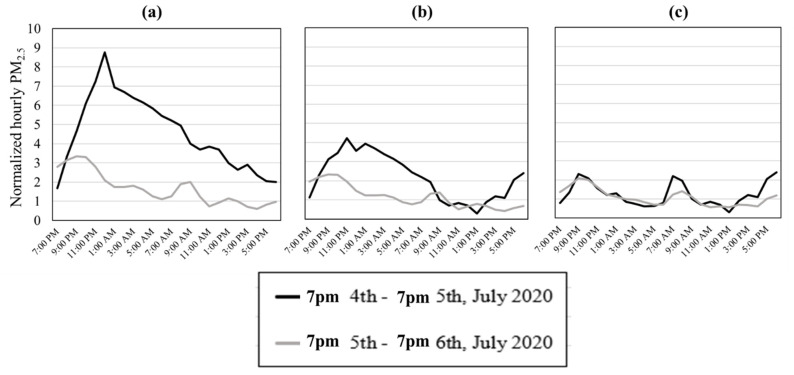
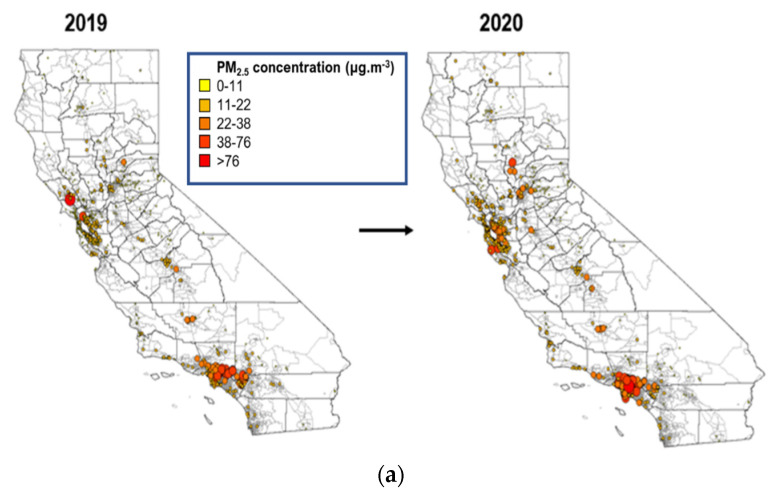
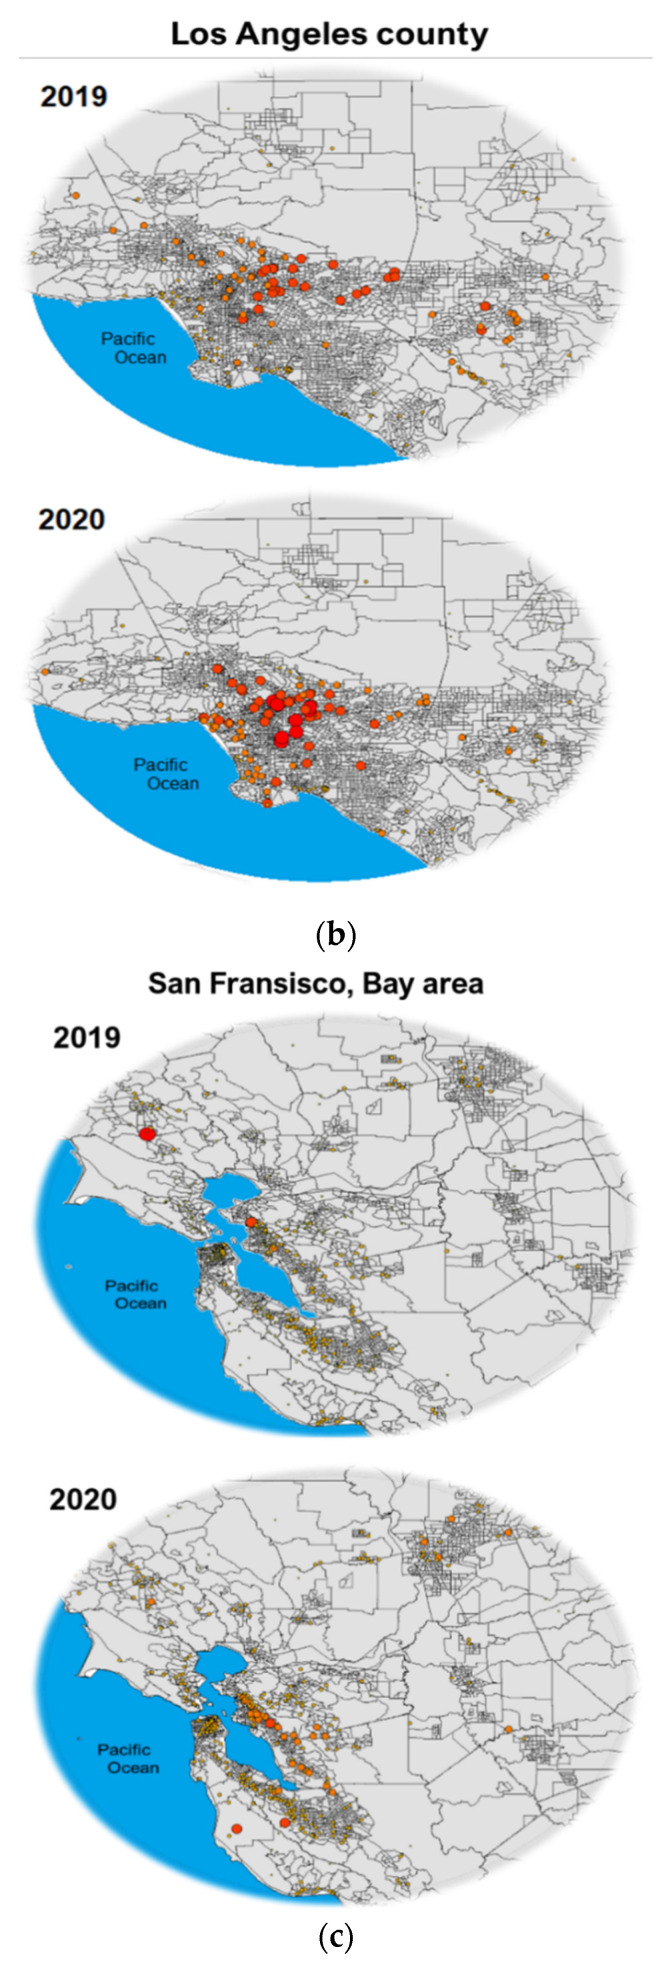
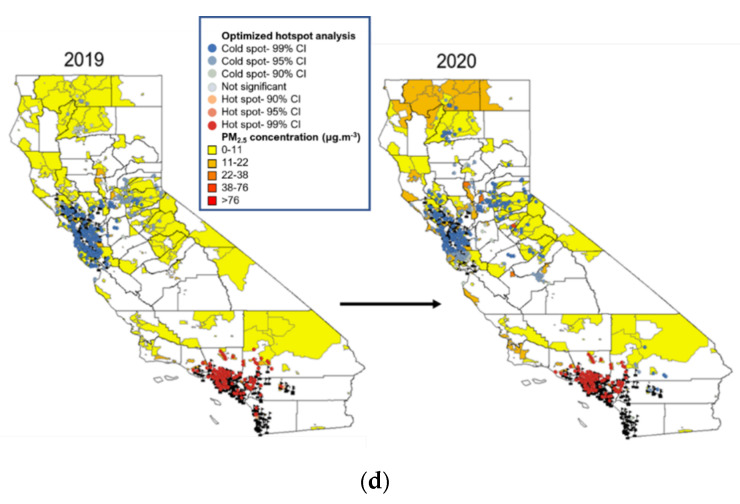
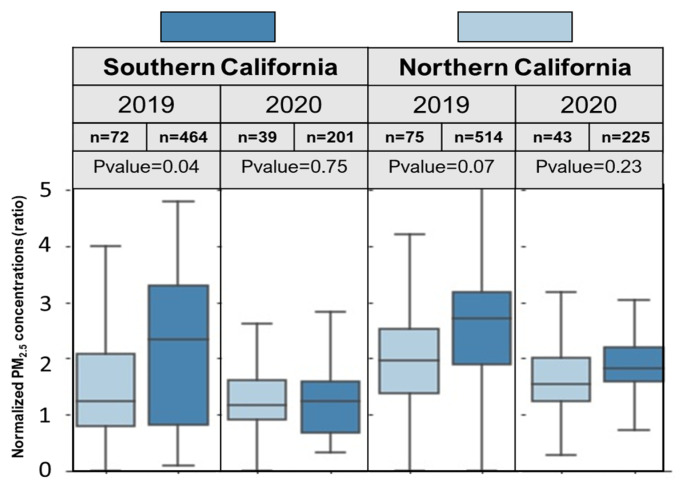
Fireworks are often used in celebration, causing short term, extremely high particulate matter air pollution. In recent years, the rapid development and expansion of low-cost air quality sensors by companies such as PurpleAir has enabled an understanding of air pollution at a much higher spatiotemporal resolution compared to traditional monitoring networks. In this study, real-time PM2.5 measurements from 751 PurpleAir sensors operating from June to July in 2019 and 2020 were used to examine the impact of 4th of July fireworks on hourly and daily PM2.5 concentrations at the census tract and county levels in California. American Community Survey (ACS) and CalEnviroScreen 3.0 data were used to identify correlations between PM2.5 measurements and socioeconomic status (SES). A two-step method was implemented to assure the quality of raw PM2.5 sensor data and sensor calibration against co-located reference instruments. The results showed that over 67% and 81% of counties experienced immediate impacts related to fireworks in 2019 and 2020, respectively. Relative to 2019, the peak PM2.5 concentrations on July 4th and 5th 2020 were, on average, over 50% higher in California, likely due to the COVID-19-related increase in the use of household-level fireworks. This increase was most pronounced in southern counties, which tend to have less strict firework-related regulations and a greater use of illegal fireworks. Los Angeles County experienced the highest July 4th daily PM2.5 levels both in 2019 (29.9 µg·m-3) and 2020 (42.6 µg·m-3). Spatial hot spot analyses generally showed these southern counties (e.g., Los Angeles County) to be regional air pollution hotspots, whereas the opposite pattern was seen in the north (e.g., San Francisco). The results also showed PM2.5 peaks that were over two-times higher among communities with lower SES, higher minority group populations, and higher asthma rates. Our findings highlight the important role that policy and enforcement can play in reducing firework-related air pollution and protecting public health, as exemplified by southern California, where policy was more relaxed and air pollution was higher (especially in 2020 when the 4th of July coincided with the COVID-19-lockdown period), and in disadvantaged communities where disparities were greatest.
Keywords: Independence Day; PurpleAir; air quality; firework; low-cost sensors; particulate matter.
Conflict of interest statement
The authors declare no conflict of interest.
Figures
Similar articles
-
Race and Street-Level Firework Legalization as Primary Determinants of July 4th Air Pollution across Southern California.Atmosphere (Basel). 2023 Feb;14(2):401. doi: 10.3390/atmos14020401. Epub 2023 Feb 19. Atmosphere (Basel). 2023. PMID: 39267917 Free PMC article.
-
Exploring the distributional environmental justice implications of an air quality monitoring network in Los Angeles County.Environ Res. 2022 Apr 15;206:112612. doi: 10.1016/j.envres.2021.112612. Epub 2021 Dec 23. Environ Res. 2022. PMID: 34953883
-
Skyrocketing pollution: assessing the environmental fate of July 4th fireworks in New York City.J Expo Sci Environ Epidemiol. 2025 Apr;35(2):214-222. doi: 10.1038/s41370-024-00701-x. Epub 2024 Aug 6. J Expo Sci Environ Epidemiol. 2025. PMID: 39107528
-
Low-Cost Particulate Matter Mass Sensors: Review of the Status, Challenges, and Opportunities for Single-Instrument and Network Calibration.ACS Sens. 2025 May 23;10(5):3207-3221. doi: 10.1021/acssensors.4c03293. Epub 2025 May 7. ACS Sens. 2025. PMID: 40331533 Review.
-
Spatial analysis of COVID-19 and traffic-related air pollution in Los Angeles.Environ Int. 2021 Aug;153:106531. doi: 10.1016/j.envint.2021.106531. Epub 2021 Mar 22. Environ Int. 2021. PMID: 33812043 Free PMC article. Review. No abstract available.
Cited by
-
Fine Particulate Matter Concentrations during Independence Day Fireworks Display in the Lower Rio Grande Valley Region, South Texas, USA.ScientificWorldJournal. 2022 Sep 12;2022:8413574. doi: 10.1155/2022/8413574. eCollection 2022. ScientificWorldJournal. 2022. PMID: 36132439 Free PMC article.
-
Data-Driven Placement of PM2.5 Air Quality Sensors in the United States: An Approach to Target Urban Environmental Injustice.Geohealth. 2023 Sep 13;7(9):e2023GH000834. doi: 10.1029/2023GH000834. eCollection 2023 Sep. Geohealth. 2023. PMID: 37711364 Free PMC article.
-
Methods in Public Health Environmental Justice Research: a Scoping Review from 2018 to 2021.Curr Environ Health Rep. 2023 Sep;10(3):312-336. doi: 10.1007/s40572-023-00406-7. Epub 2023 Aug 15. Curr Environ Health Rep. 2023. PMID: 37581863 Free PMC article.
-
Unequal airborne exposure to toxic metals associated with race, ethnicity, and segregation in the USA.Nat Commun. 2022 Nov 1;13(1):6329. doi: 10.1038/s41467-022-33372-z. Nat Commun. 2022. PMID: 36319637 Free PMC article.
-
Bronchiolitis recovery and the use of High Efficiency Particulate Air (HEPA) Filters (The BREATHE Study): study protocol for a multi-center, parallel, double-blind, randomized controlled clinical trial.Trials. 2024 Mar 20;25(1):197. doi: 10.1186/s13063-024-08012-0. Trials. 2024. PMID: 38504367 Free PMC article.
References
-
- Dickerson A.S., Benson A.F., Buckley B., Chan E.A.W. Concentrations of individual fine particulate matter components in the USA around July 4th. Air Qual. Atmos. Health. 2017;10:349–358. doi: 10.1007/s11869-016-0433-0. - DOI
-
- Joly A., Smargiassi A., Kosatsky T., Fournier M., Dabek-Zlotorzynska E., Celo V., Mathieu D., Servranckx R., D’Amours R., Malo A., et al. Characterisation of particulate exposure during fireworks displays. Atmos. Environ. 2010;44:4325–4329. doi: 10.1016/j.atmosenv.2009.12.010. - DOI
-
- Yao L., Wang D., Fu Q., Qiao L., Wang H., Li L., Sun W., Li Q., Wang L., Yang X., et al. The effects of firework regulation on air quality and public health during the Chinese Spring Festival from 2013 to 2017 in a Chinese megacity. Environ. Int. 2019;126:96–106. doi: 10.1016/j.envint.2019.01.037. - DOI - PubMed
