

Cataract Development by Exposure to Ultraviolet and Blue Visible Light in Porcine Lenses
- PMID: 34071808
- PMCID: PMC8227611
- DOI: 10.3390/medicina57060535
Cataract Development by Exposure to Ultraviolet and Blue Visible Light in Porcine Lenses
Abstract
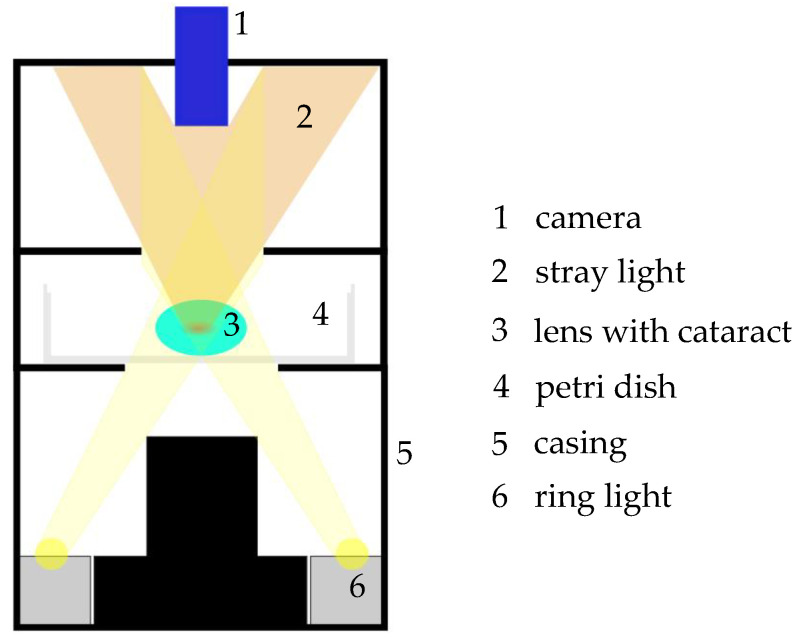
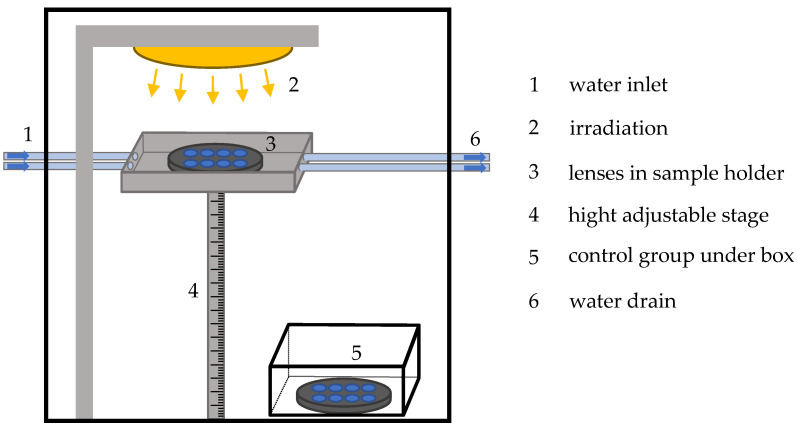
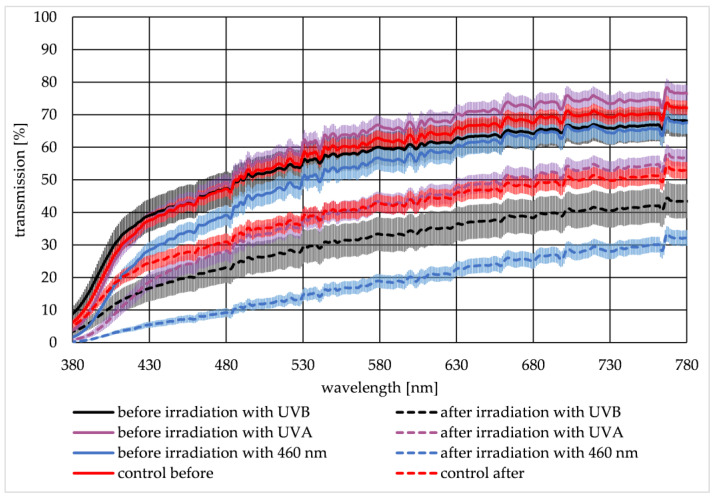
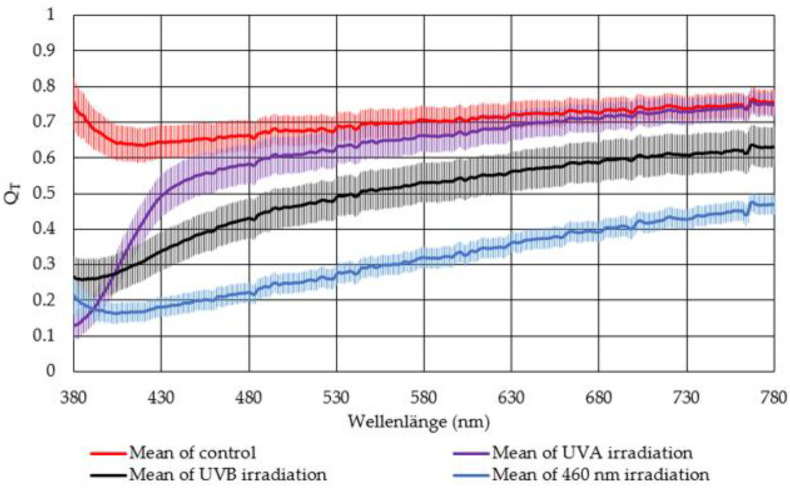
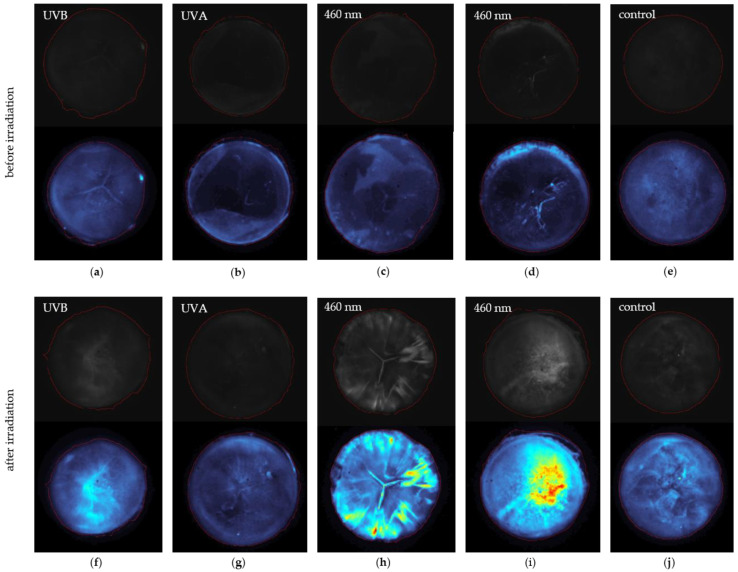
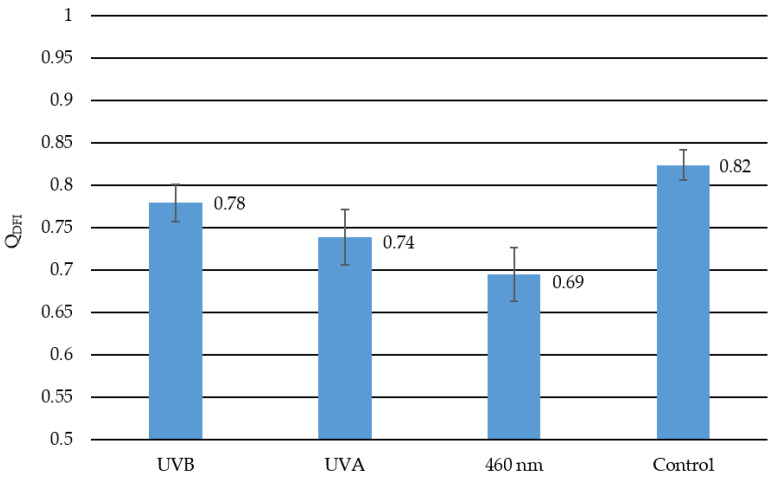
Background and Objectives: Cataract is still the leading cause of blindness. Its development is well researched for UV radiation. Modern light sources like LEDs and displays tend to emit blue light. The effect of blue light on the retina is called blue light hazard and is studied extensively. However, its impact on the lens is not investigated so far. Aim: Investigation of the impact of the blue visible light in porcine lens compared to UVA and UVB radiation. Materials and Methods: In this ex-vivo experiment, porcine lenses are irradiated with a dosage of 6 kJ/cm2 at wavelengths of 311 nm (UVB), 370 nm (UVA), and 460 nm (blue light). Lens transmission measurements before and after irradiation give insight into the impact of the radiation. Furthermore, dark field images are taken from every lens before and after irradiation. Cataract development is illustrated by histogram linearization as well as faults coloring of recorded dark field images. By segmenting the lens in the background's original image, the lens condition before and after irradiation could be compared. Results: All lenses irradiated with a 6 kJ/cm2 reveal cataract development for radiation with 311 nm, 370 nm, and 460 nm. Both evaluations reveal that the 460 nm irradiation causes the most cataract. Conclusion: All investigated irradiation sources cause cataracts in porcine lenses-even blue visible light.
Keywords: UV radiation; UVA; UVB; blue light; cataract; porcine lens.
Conflict of interest statement
The authors declare no conflict of interest.
Figures
Similar articles
-
Influence of Visible Violet, Blue and Red Light on the Development of Cataract in Porcine Lenses.Medicina (Kaunas). 2022 May 27;58(6):721. doi: 10.3390/medicina58060721. Medicina (Kaunas). 2022. PMID: 35743984 Free PMC article.
-
Development and repair of cataract induced by ultraviolet radiation.Ophthalmic Res. 2000;32 Suppl 1:ii-iii; 1-44. Ophthalmic Res. 2000. PMID: 10817682
-
Ultraviolet radiation-B-induced cataract in albino rats: maximum tolerable dose and ascorbate consumption.Acta Ophthalmol Scand. 2006 Jun;84(3):390-5. doi: 10.1111/j.1600-0420.2006.00640.x. Acta Ophthalmol Scand. 2006. PMID: 16704705
-
Ultraviolet radiation and cataract.J Ocul Pharmacol Ther. 2000 Jun;16(3):285-97. doi: 10.1089/jop.2000.16.285. J Ocul Pharmacol Ther. 2000. PMID: 10872925 Review.
-
Experimental cataract induced by ultraviolet radiation.Acta Ophthalmol Suppl (1985). 1990;(196):1-75. Acta Ophthalmol Suppl (1985). 1990. PMID: 2161611 Review.
Cited by
-
Online Learning-Related Visual Function Impairment During and After the COVID-19 Pandemic.Front Public Health. 2021 Nov 29;9:645971. doi: 10.3389/fpubh.2021.645971. eCollection 2021. Front Public Health. 2021. PMID: 34912766 Free PMC article. Review.
-
Antimicrobial Resistance: Is There a 'Light' at the End of the Tunnel?Antibiotics (Basel). 2023 Sep 12;12(9):1437. doi: 10.3390/antibiotics12091437. Antibiotics (Basel). 2023. PMID: 37760734 Free PMC article. Review.
-
Blue Light Exposure: Ocular Hazards and Prevention-A Narrative Review.Ophthalmol Ther. 2023 Apr;12(2):755-788. doi: 10.1007/s40123-023-00675-3. Epub 2023 Feb 18. Ophthalmol Ther. 2023. PMID: 36808601 Free PMC article. Review.
-
Colorimetric and Photobiological Properties of Light Transmitted Through Low-Vision Filters: Simulated Potential Impact on ipRGCs Responses Considering Crystalline Lens Aging.Life (Basel). 2025 Feb 8;15(2):261. doi: 10.3390/life15020261. Life (Basel). 2025. PMID: 40003670 Free PMC article.
-
222-Nanometer Far-UVC Exposure Results in DNA Damage and Transcriptional Changes to Mammalian Cells.Int J Mol Sci. 2022 Aug 14;23(16):9112. doi: 10.3390/ijms23169112. Int J Mol Sci. 2022. PMID: 36012379 Free PMC article.
References
-
- Bourne R., Adelson J., Flaxman S., Briant P.S., Taylor H.R., Casson R.J., Bikbov M.M., Bottone M., Braithwaite T., Bron A., et al. Trends in Prevalence of Blindness and Distance and Near Vision Impairment over 30 Years and Contribution to the Global Burden of Disease in 2020. SSRN J. 2020 doi: 10.2139/ssrn.3582742. - DOI
-
- Bourne R.R.A., Jonas J.B., Bron A.M., Cicinelli M.V., Das A., Flaxman S.R., Friedman D.S., Keeffe J.E., Kempen J.H., Leasher J., et al. Prevalence and causes of vision loss in high-income countries and in Eastern and Central Europe in 2015: Magnitude, temporal trends and projections. Br. J. Ophthalmol. 2018;102:575–585. doi: 10.1136/bjophthalmol-2017-311258. - DOI - PMC - PubMed
-
- Stevens G.A., White R.A., Flaxman S.R., Price H., Jonas J.B., Keeffe J., Leasher J., Naidoo K., Pesudovs K., Resnikoff S., et al. Global prevalence of vision impairment and blindness: Magnitude and temporal trends, 1990–2010. Ophthalmology. 2013;120:2377–2384. doi: 10.1016/j.ophtha.2013.05.025. - DOI - PubMed
MeSH terms
LinkOut - more resources
Full Text Sources
Medical
