. 2021 May 27;11(6):713.
doi: 10.3390/brainsci11060713.

Bimodal Data Fusion of Simultaneous Measurements of EEG and fNIRS during Lower Limb Movements

Affiliations

Bimodal Data Fusion of Simultaneous Measurements of EEG and fNIRS during Lower Limb Movements

Maged S Al-Quraishi et al. Brain Sci. .

Abstract

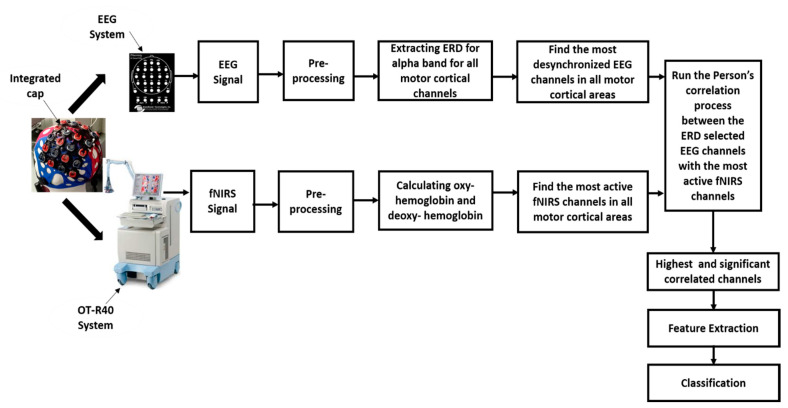
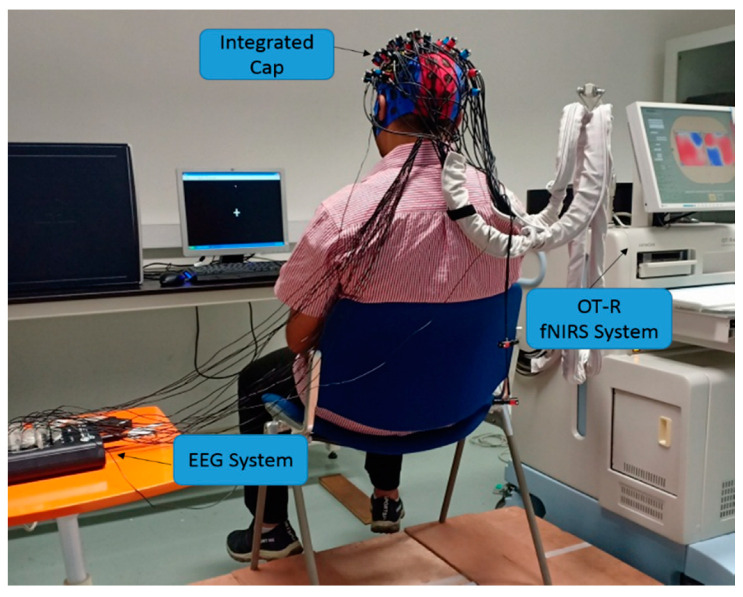
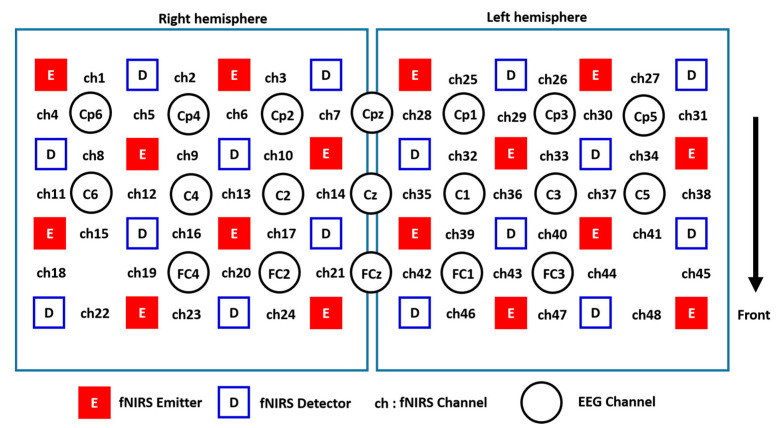
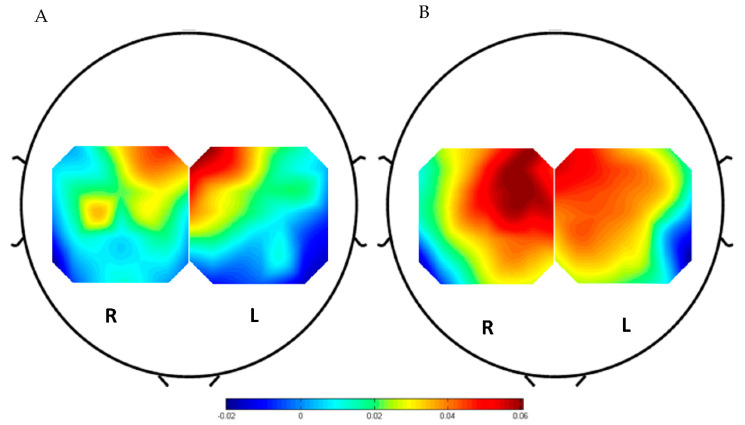
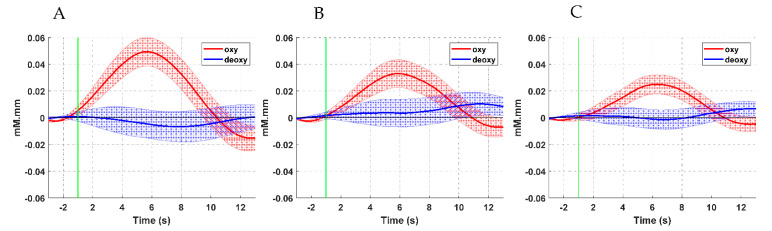
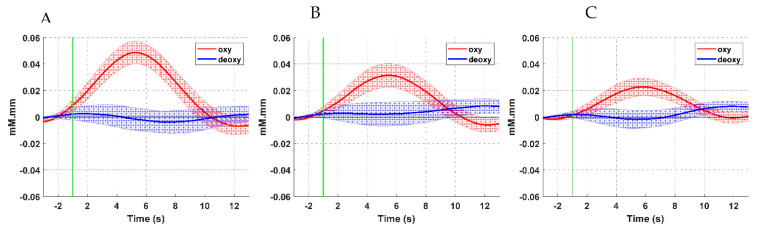
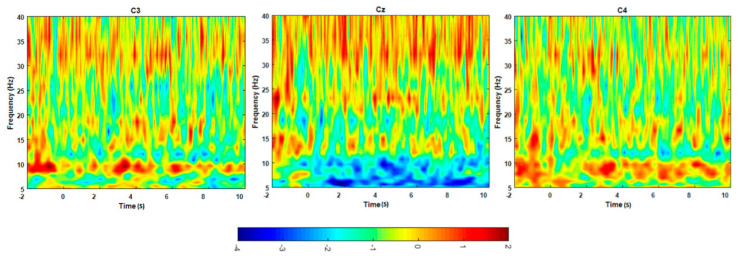
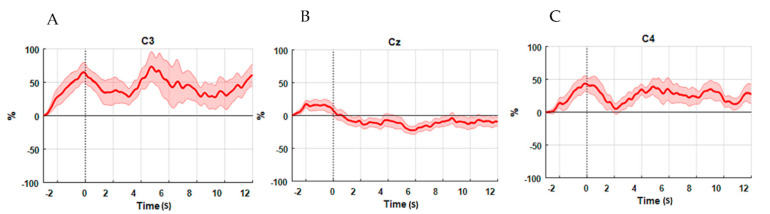
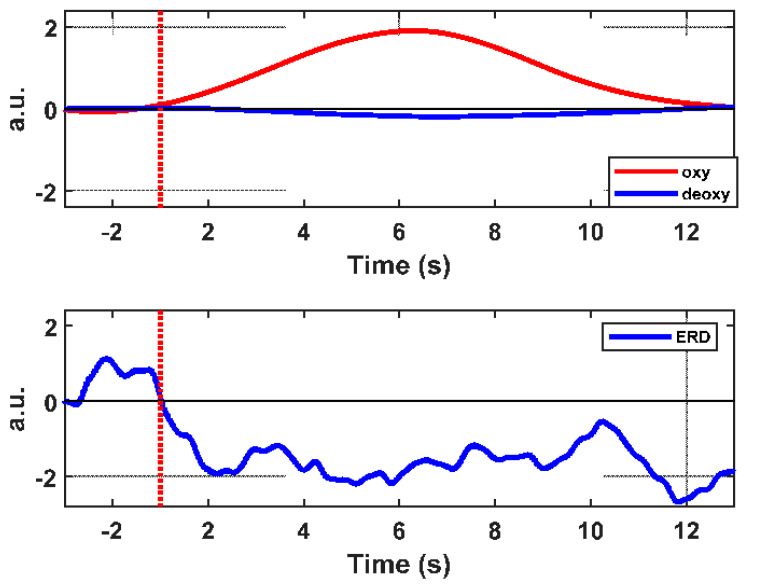
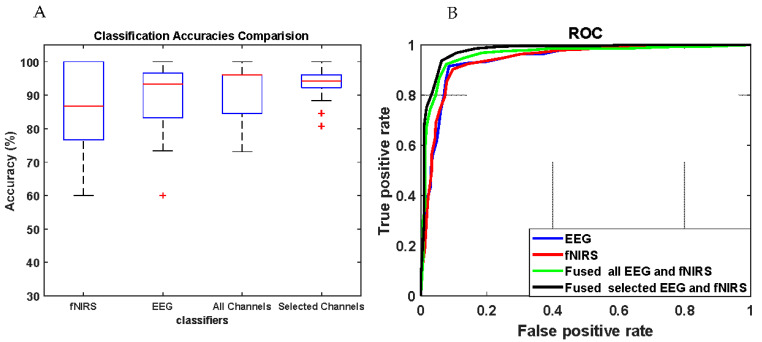
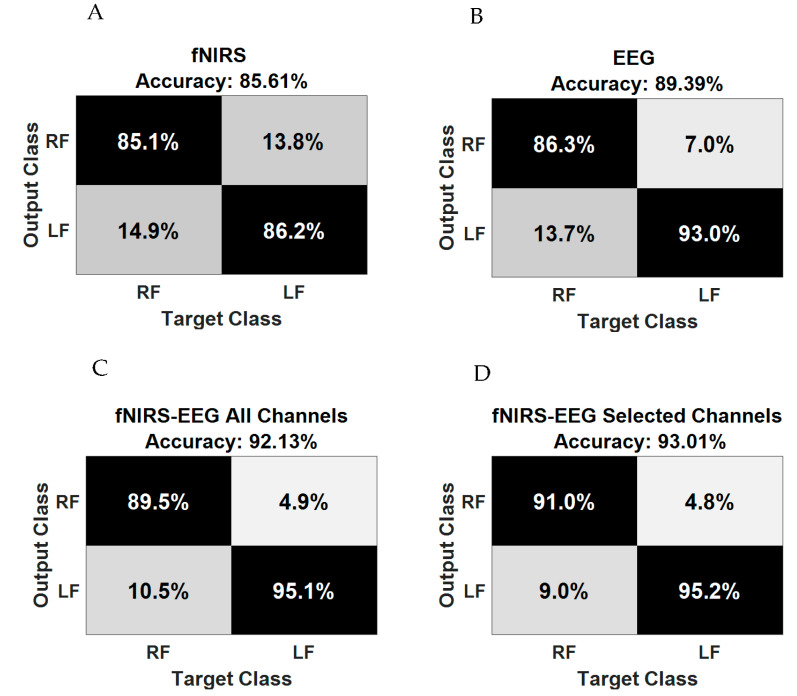
Electroencephalography (EEG) and functional near-infrared spectroscopy (fNIRS) have temporal and spatial characteristics that may complement each other and, therefore, pose an intriguing approach for brain-computer interaction (BCI). In this work, the relationship between the hemodynamic response and brain oscillation activity was investigated using the concurrent recording of fNIRS and EEG during ankle joint movements. Twenty subjects participated in this experiment. The EEG was recorded using 20 electrodes and hemodynamic responses were recorded using 32 optodes positioned over the motor cortex areas. The event-related desynchronization (ERD) feature was extracted from the EEG signal in the alpha band (8-11) Hz, and the concentration change of the oxy-hemoglobin (oxyHb) was evaluated from the hemodynamics response. During the motor execution of the ankle joint movements, a decrease in the alpha (8-11) Hz amplitude (desynchronization) was found to be correlated with an increase of the oxyHb (r = -0.64061, p < 0.00001) observed on the Cz electrode and the average of the fNIRS channels (ch28, ch25, ch32, ch35) close to the foot area representation. Then, the correlated channels in both modalities were used for ankle joint movement classification. The result demonstrates that the integrated modality based on the correlated channels provides a substantial enhancement in ankle joint classification accuracy of 93.01 ± 5.60% (p < 0.01) compared with single modality. These results highlight the potential of the bimodal fNIR-EEG approach for the development of future BCI for lower limb rehabilitation.

Keywords: EEG; fNIRS; lower limb movements; neurovascular coupling.


Conflict of interest statement

The authors declare no conflict of interest.

Figures

Figure 1
Figure 1
The proposed framework of functional near-infrared spectroscopy (fNIRS)–electroencephalography (EEG) simultaneous measurements and analysis during lower limb movements. ERD, event-related desynchronization.
Figure 2
Figure 2
Subject position during the data collection process. EEG electrodes and fNIRS optodes connected to the integrated cap on the subject’s head, with the subject sat on a chair in front of an instruction monitor.
Figure 3
Figure 3
Experimental protocol timeline during the ankle joint movement. The trial started with 15 s rest until the cue signal appeared on the screen to indicate the right or left movements, then the subject moved his ankle for 12 s until the (+) sign disappeared.
Figure 4
Figure 4
Distribution of the EEG electrodes and fNIRS optodes placed on both hemispheres of the motor cortex area.
Figure 5
Figure 5
Average topoplot of oxyHb concentration of motor cortex (A) during right ankle movement and (B) during left ankle movement.
Figure 6
Figure 6
Time course of the averaged oxyHb and deoxyHb of the selected channels with respect to the motor cortex areas during right ankle joint movement: (A) LPMCdr, (B) LPMCvr, and (C) LPMA.
Figure 7
Figure 7
Time course of the averaged oxyHb and deoxyHb of the selected channels with respect to the motor cortex areas during left ankle joint movement: (A) RPMCdr, (B) RPMCvr, and (C) RPMA.
Figure 8
Figure 8
Time frequency map of the average across the participants during the ankle movements; the left map represents left motor cortex area C3, the middle image represents Cz area, whereas the right image represents right motor cortex area C4.
Figure 9
Figure 9
Time course of the ERD/ERS transitions for right ankle joint movements. The EEG signals power of (A) C3, (B) Cz, and (C) C4.
Figure 10
Figure 10
The time evaluation period of the ERD and hemodynamic response, oxyHb in the upper plot red line. ERD represented by the blue line in the lower plot.
Figure 11
Figure 11
(A) Classification accuracies of ankle joint movements based on the single and bi-modilties; the (+) symbols represent the outliers’ values. (B) ROC for EEG, fNIRS, and integrated EEG and fNIRS.
Figure 12
Figure 12
Confusion matrix of (A) fNIRS alone, (B) EEG alone, (C) fNIRS–EEG based on all channels, and (D) fNIRS–EEG based on selected channels.

Similar articles

Cited by

References

    1. Eichele T., Specht K., Moosmann M., Jongsma M.L.A., Quiroga R.Q., Nordby H., Hugdahl K. Assessing the spatiotemporal evolution of neuronal activation with single-trial event-related potentials and functional MRI. Proc. Natl. Acad. Sci. USA. 2005;102:17798–17803. doi: 10.1073/pnas.0505508102. - DOI - PMC - PubMed
    1. Debener S., Ullsperger M., Siegel M., Engel A.K. Single-trial EEG-fMRI reveals the dynamics of cognitive function. Trends Cogn. Sci. 2006;10:558–563. doi: 10.1016/j.tics.2006.09.010. - DOI - PubMed
    1. Dale A.M., Halgren E. Spatiotemporal mapping of brain activity by integration of multiple imaging modalities. Curr. Opin. Neurobiol. 2001;11:202–208. doi: 10.1016/S0959-4388(00)00197-5. - DOI - PubMed
    1. Vulliemoz S., Carmichael D.W., Rosenkranz B., Rodionov R., Walker M.C., McEvoy A.W., Lemieux L. Simultaneous intracranial EEG and fMRI of interictal epileptic discharges in humans. NeuroImage. 2011;54:182–190. doi: 10.1016/j.neuroimage.2010.08.004. - DOI - PubMed
    1. Fazli S., Mehnert J., Steinbrink J., Curio G., Villringer A., Müller K.R., Blankertz B. Enhanced performance by a hybrid NIRS-EEG brain computer interface. NeuroImage. 2012;59:519–529. doi: 10.1016/j.neuroimage.2011.07.084. - DOI - PubMed

LinkOut - more resources