

Comparison of Selection Signatures between Korean Native and Commercial Chickens Using 600K SNP Array Data
- PMID: 34072132
- PMCID: PMC8230197
- DOI: 10.3390/genes12060824
Comparison of Selection Signatures between Korean Native and Commercial Chickens Using 600K SNP Array Data
Abstract
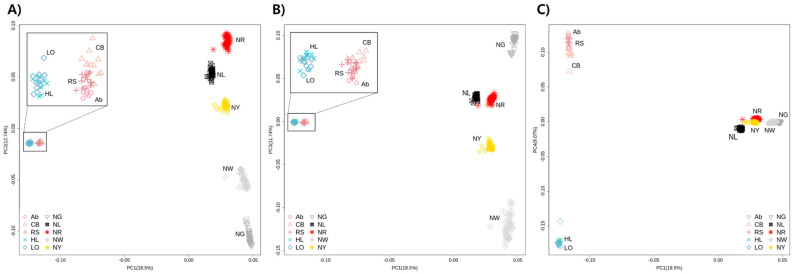
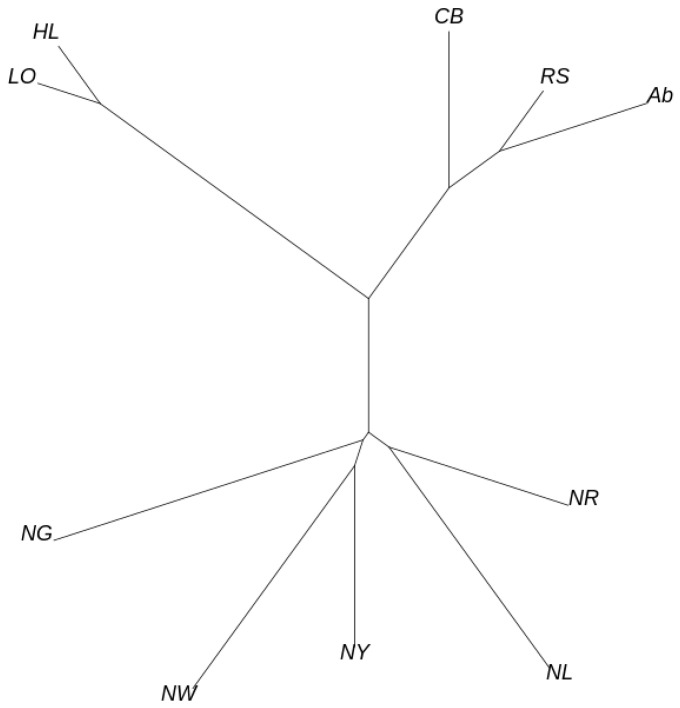
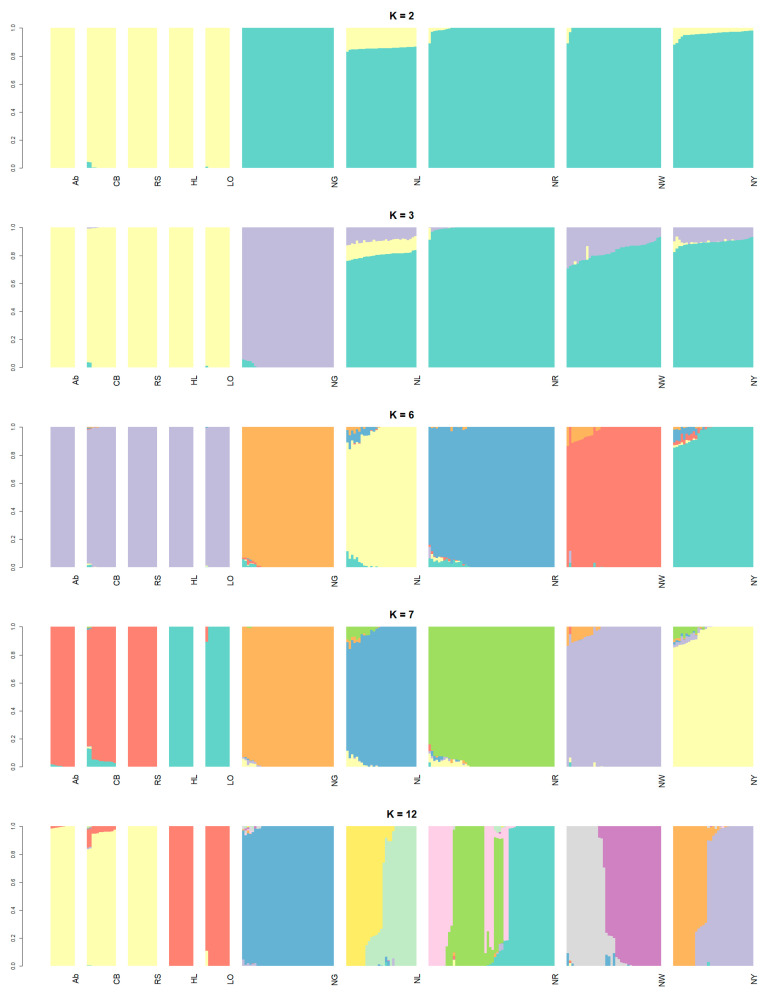
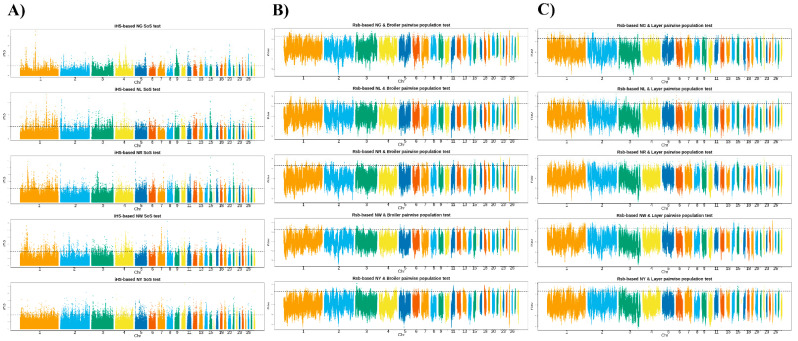
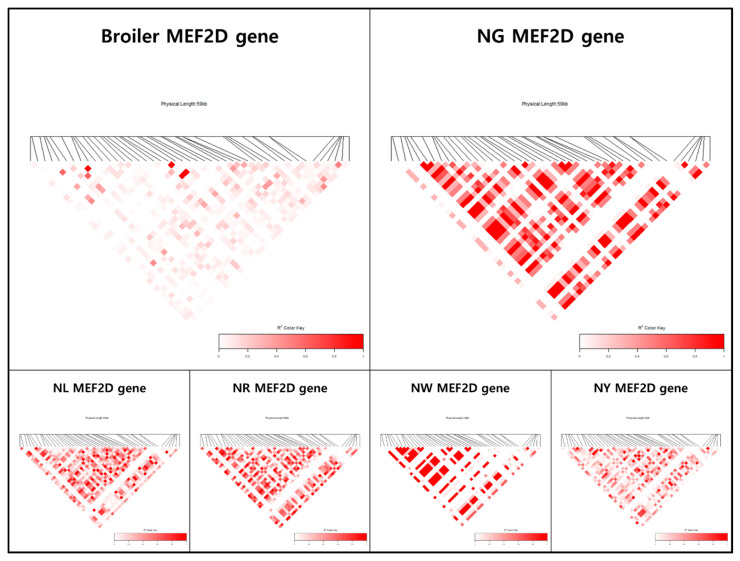
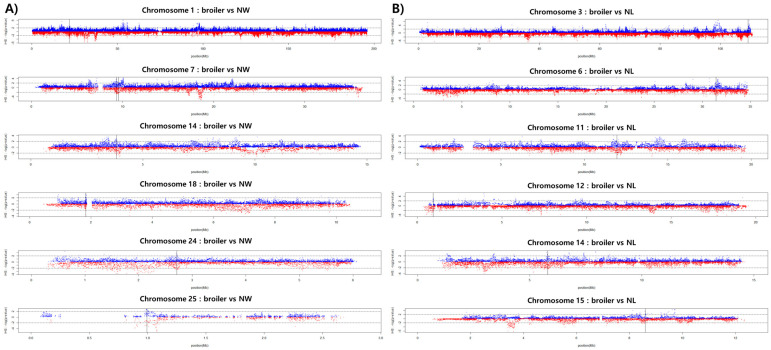
Korean native chickens (KNCs) comprise an indigenous chicken breed of South Korea that was restored through a government project in the 1990s. The KNC population has not been developed well and has mostly been used to maintain purebred populations in the government research institution. We investigated the genetic features of the KNC population in a selection signal study for the efficient improvement of this breed. We used 600K single nucleotide polymorphism data sampled from 191 KNCs (NG, 38; NL, 29; NR, 52; NW, 39; and NY, 33) and 54 commercial chickens (Hy-line Brown, 10; Lohmann Brown, 10; Arbor Acres, 10; Cobb, 12; and Ross, 12). Haplotype phasing was performed using EAGLE software as the initial step for the primary data analysis. Pre-processed data were analyzed to detect selection signals using the 'rehh' package in R software. A few common signatures of selection were identified in KNCs. Most quantitative trait locus regions identified as candidate regions were associated with traits related to reproductive organs, eggshell characteristics, immunity, and organ development. Block patterns with high linkage disequilibrium values were observed for LPP, IGF11, LMNB2, ERBB4, GABRB2, NTM, APOO, PLOA1, CNTN1, NTSR1, DEF3, CELF1, and MEF2D genes, among regions with confirmed selection signals. NL and NW lines contained a considerable number of selective sweep regions related to broilers and layers, respectively. We recommend focusing on improving the egg and meat traits of KNC NL and NW lines, respectively, while improving multiple traits for the other lines.
Keywords: Korean native chicken; quantitative trait locus; signature of selection.
Conflict of interest statement
The authors declare no conflict of interest.
Figures
Similar articles
-
Detection of genomic signatures of recent selection in commercial broiler chickens.BMC Genet. 2016 Aug 26;17(1):122. doi: 10.1186/s12863-016-0430-1. BMC Genet. 2016. PMID: 27565946 Free PMC article.
-
Genome-wide characterization of genetic variants and putative regions under selection in meat and egg-type chicken lines.BMC Genomics. 2018 Jan 25;19(1):83. doi: 10.1186/s12864-018-4444-0. BMC Genomics. 2018. PMID: 29370772 Free PMC article.
-
Artificial selection footprints in indigenous and commercial chicken genomes.BMC Genomics. 2024 Apr 30;25(1):428. doi: 10.1186/s12864-024-10291-5. BMC Genomics. 2024. PMID: 38689225 Free PMC article.
-
Genome Scan for Selection in Structured Layer Chicken Populations Exploiting Linkage Disequilibrium Information.PLoS One. 2015 Jul 7;10(7):e0130497. doi: 10.1371/journal.pone.0130497. eCollection 2015. PLoS One. 2015. PMID: 26151449 Free PMC article.
-
Estimation of linkage disequilibrium and analysis of genetic diversity in Korean chicken lines.PLoS One. 2018 Feb 9;13(2):e0192063. doi: 10.1371/journal.pone.0192063. eCollection 2018. PLoS One. 2018. PMID: 29425208 Free PMC article.
Cited by
-
Selective footprints and genes relevant to cold adaptation and other phenotypic traits are unscrambled in the genomes of divergently selected chicken breeds.J Anim Sci Biotechnol. 2023 Feb 24;14(1):35. doi: 10.1186/s40104-022-00813-0. J Anim Sci Biotechnol. 2023. PMID: 36829208 Free PMC article.
-
Functional Polymorphisms in the Neuropeptide Y (NPY) Gene Associated with Egg Production in Thai Native, Black-Bone, and Commercial Laying Hens Using SNP Markers.Animals (Basel). 2025 Mar 5;15(5):744. doi: 10.3390/ani15050744. Animals (Basel). 2025. PMID: 40076027 Free PMC article.
-
Genomics of Dwarfism in Italian Local Chicken Breeds.Genes (Basel). 2023 Mar 3;14(3):633. doi: 10.3390/genes14030633. Genes (Basel). 2023. PMID: 36980905 Free PMC article.
-
Special Issue: Poultry Genetics, Breeding and Biotechnology.Genes (Basel). 2021 Oct 29;12(11):1744. doi: 10.3390/genes12111744. Genes (Basel). 2021. PMID: 34828350 Free PMC article.
-
Runs of homozygosity analysis for selection signatures in the Yellow Korean native chicken.Anim Biosci. 2024 Oct;37(10):1683-1691. doi: 10.5713/ab.24.0092. Epub 2024 May 7. Anim Biosci. 2024. PMID: 38754845 Free PMC article.
References
Publication types
MeSH terms
Substances
LinkOut - more resources
Full Text Sources
Miscellaneous
