. 2021 May 27;13(11):2644.
doi: 10.3390/cancers13112644.

LncRNA PART1 Promotes Proliferation and Migration, Is Associated with Cancer Stem Cells, and Alters the miRNA Landscape in Triple-Negative Breast Cancer

Affiliations

LncRNA PART1 Promotes Proliferation and Migration, Is Associated with Cancer Stem Cells, and Alters the miRNA Landscape in Triple-Negative Breast Cancer

Brianne M Cruickshank et al. Cancers (Basel). .

Abstract

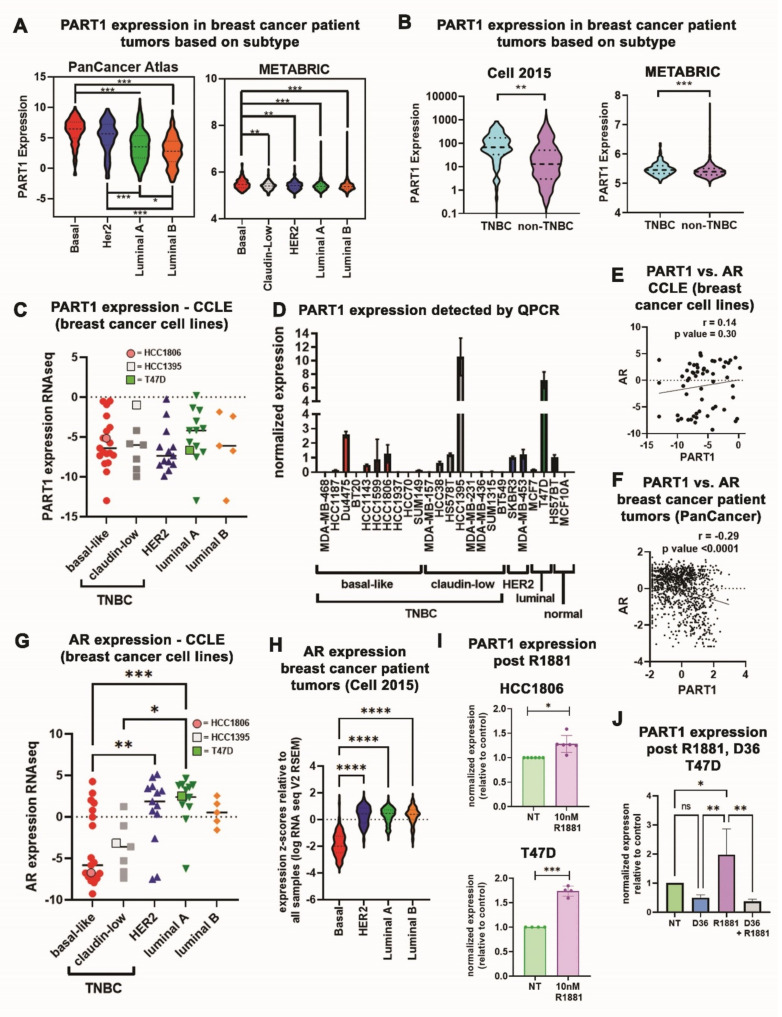
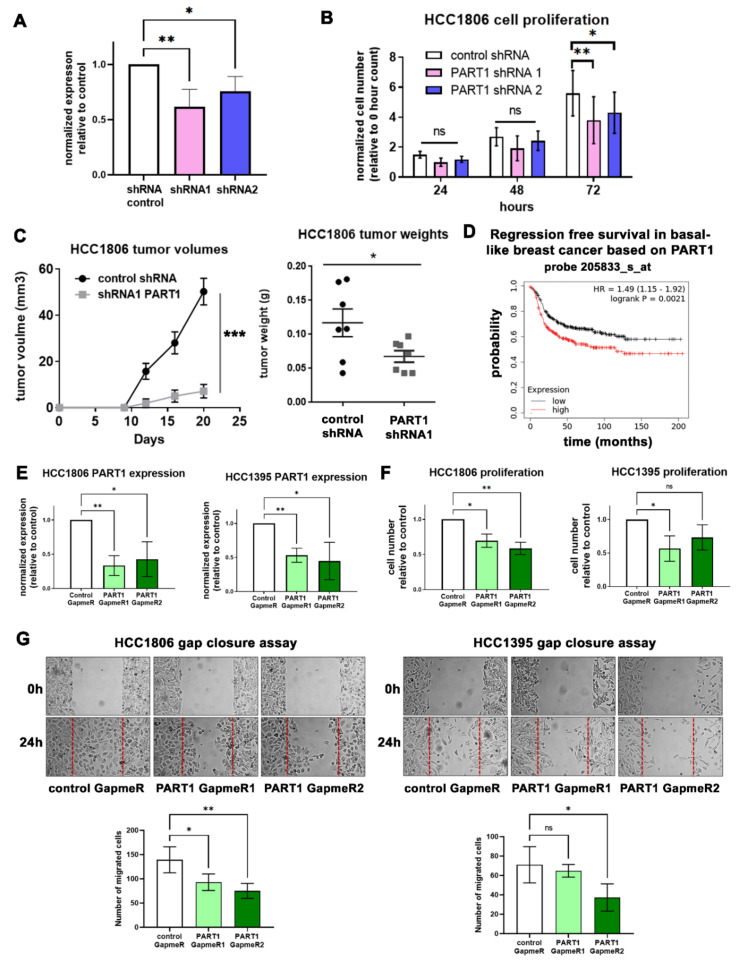
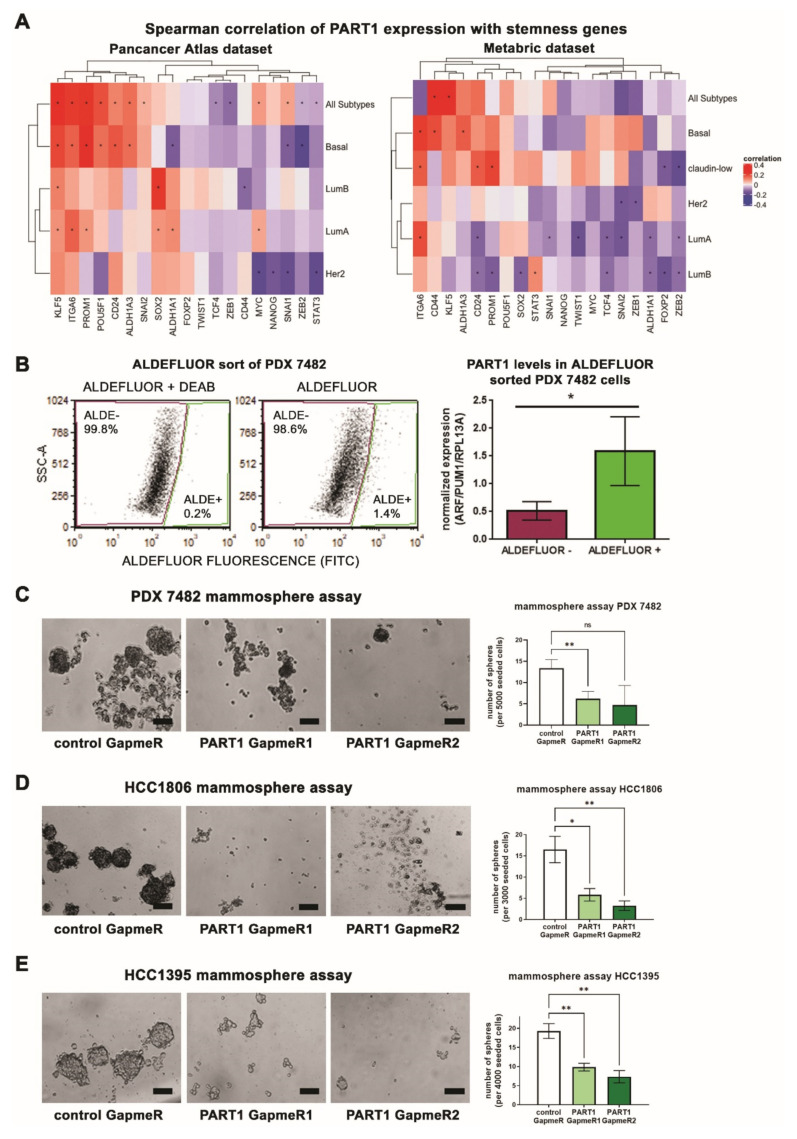
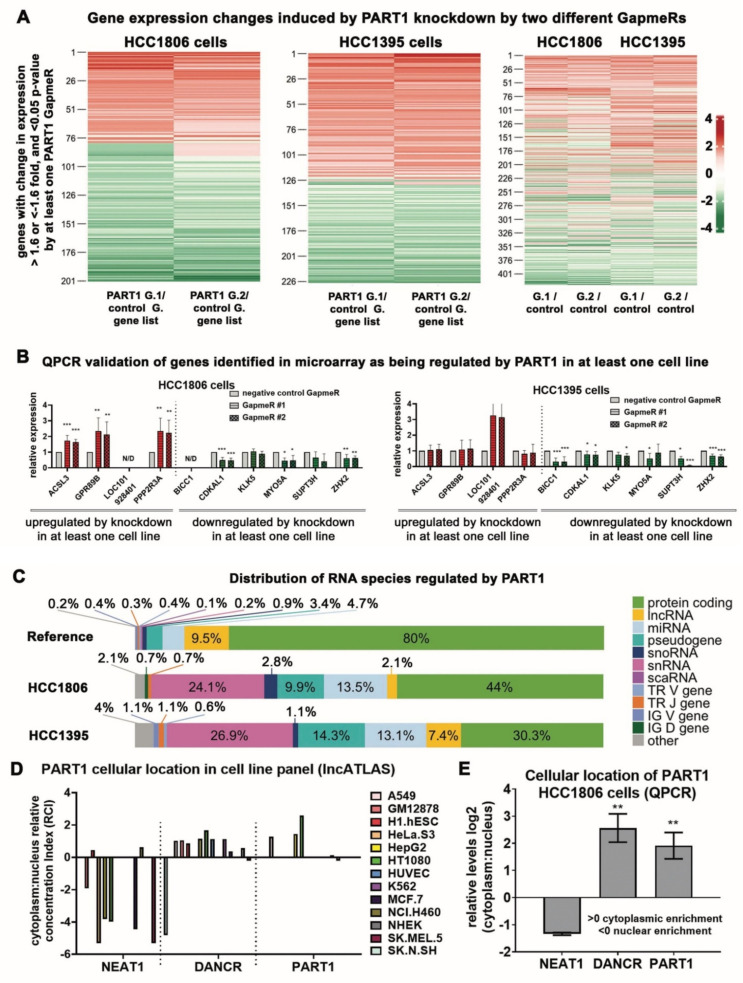
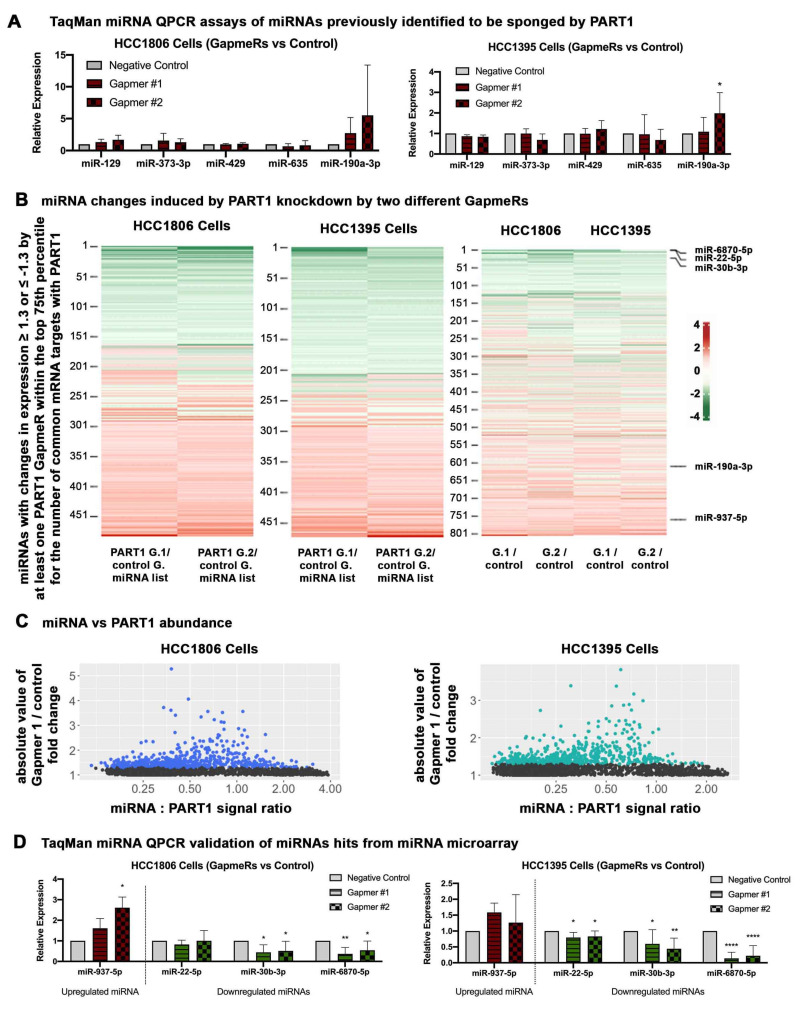
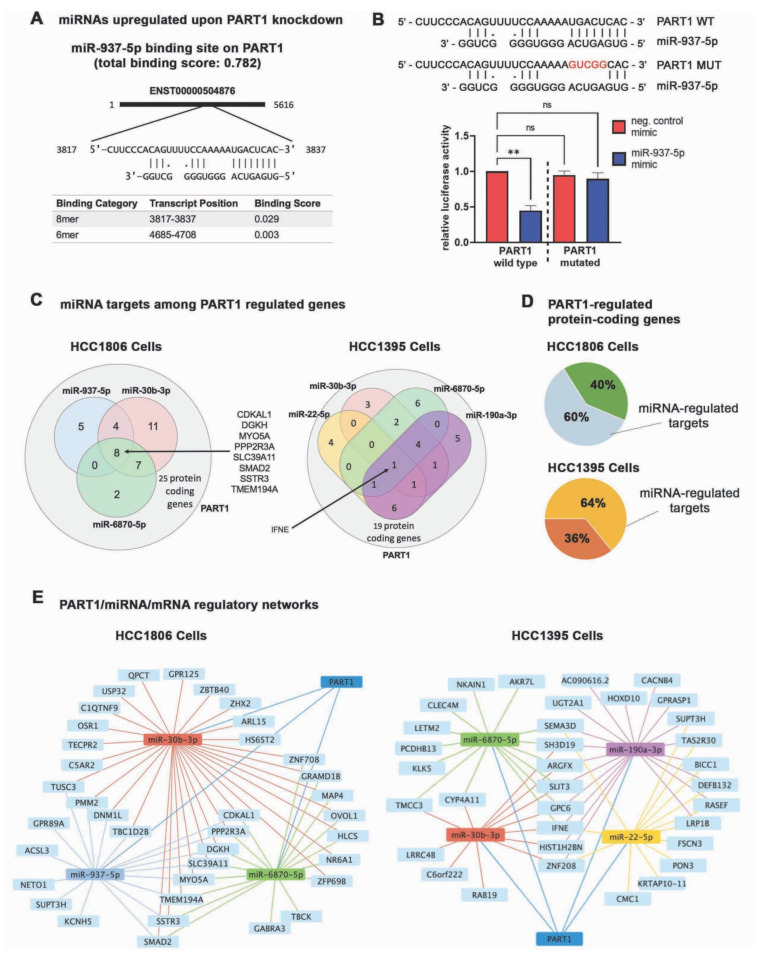
Triple-negative breast cancers (TNBCs) are aggressive, lack targeted therapies and are enriched in cancer stem cells (CSCs). Novel therapies which target CSCs within these tumors would likely lead to improved outcomes for TNBC patients. Long non-coding RNAs (lncRNAs) are potential therapeutic targets for TNBC and CSCs. We demonstrate that lncRNA prostate androgen regulated transcript 1 (PART1) is enriched in TNBCs and in Aldefluorhigh CSCs, and is associated with worse outcomes among basal-like breast cancer patients. Although PART1 is androgen inducible in breast cancer cells, analysis of patient tumors indicates its androgen regulation has minimal clinical impact. Knockdown of PART1 in TNBC cell lines and a patient-derived xenograft decreased cell proliferation, migration, tumor growth, and mammosphere formation potential. Transcriptome analyses revealed that the lncRNA affects expression of hundreds of genes (e.g., myosin-Va, MYO5A; zinc fingers and homeoboxes protein 2, ZHX2). MiRNA 4.0 GeneChip and TaqMan assays identified multiple miRNAs that are regulated by cytoplasmic PART1, including miR-190a-3p, miR-937-5p, miR-22-5p, miR-30b-3p, and miR-6870-5p. We confirmed the novel interaction between PART1 and miR-937-5p. In general, miRNAs altered by PART1 were less abundant than PART1, potentially leading to cell line-specific effects in terms miRNA-PART1 interactions and gene regulation. Together, the altered miRNA landscape induced by PART1 explains most of the protein-coding gene regulation changes (e.g., MYO5A) induced by PART1 in TNBC.

Keywords: CSCs; PART1; TNBC; lncRNA; miRNAs.


Conflict of interest statement

The authors declare no conflict of interest.

Figures

Figure 1
Figure 1
PART1 expression is enriched in TNBC patient tumors and is induced by androgenic molecules in breast cancer cells. (A,B) PART1 expression in breast cancer patient tumor cohorts based on molecular intrinsic subtypes, PAM50 or claudin-low (A) or TNBC status (B). Gene expression information was extracted from the TCGA PanCancer Atlas and Cell 2015 (RNA-seq) and the METABRIC (microarray) datasets via cBioPortal (1 May 2020). Significance comparing TNBC versus non-TNBC groups was determined using an unpaired two-tailed t-test, while comparisons of multiple groups determined with a one-way ANOVA followed by Tukey’s multiple comparison post-test. (C) Expression of PART1 in 57 breast cancer cell lines (RNA-seq) was extracted from the CCLE and grouped based on molecular intrinsic subtypes, significance assessed with a one-way ANOVA followed by Tukey’s multiple comparison post-test (no comparison was significant). (D) Expression of PART1 (QPCR) in 22 different breast cancer cell lines and two normal immortalized breast cell lines. Expression is relative to reference genes ADP-ribosylation factor 1 (ARF1) and pumilio RNA binding family member 1 (PUM1) (n = 4). Error bars represent standard error of the mean (SEM). (E) Expression of PART1 versus AR in 57 breast cancer cell lines (RNA-seq) was extracted from the CCLE. The correlation (r) and p-value were determined by Pearson’s correlation coefficient. (F) Expression of PART1 versus AR in breast cancer patient tumors from the Cell 2015 (RNA-seq) dataset was extracted via cBioPortal and the correlation (r) and p-value determine by Pearson’s correlation coefficient. (G) Expression of AR in 57 breast cancer cell lines (RNA-seq) was extracted from the CCLE and grouped based on molecular intrinsic subtypes, significance assessed with a one-way ANOVA followed by Tukey’s multiple comparisons post-test. (H) Expression of AR in breast cancer patient tumors based on molecular intrinsic subtypes was extracted from the Cell 2015 (RNA-seq) dataset via cBioPortal and a one-way ANOVA followed by Tukey’s multiple comparisons post-test was performed to determine significance. (I) The effect of R1881 synthetic androgen on PART1 expression in HCC1806 and T47D cells was assessed by QPCR and is reported relative to reference genes (PUM1 and ARF1) and control no treatment cells (n = 4–6). Significance was determined by a paired two-tailed t-test (error bars represent standard deviation, SD). (J) The effect of R1881 and AR antagonist D36 on PART1 expression in T47D cells was assessed by QPCR and is reported relative to reference genes (PUM1, ARF1, and beta-2 microglobulin (B2M)) and control no treatment cells (n = 4). Significance was determined by two-way ANOVA followed by Tukey’s multiple comparisons post-test. Significant p values are indicated as follows in the figures: p < 0.05 = *, p < 0.01 = **, p < 0.001 = ***, p < 0.0001 = ****. Non-significant p values are either indicated as ns, or not noted.
Figure 2
Figure 2
PART1 expression promotes proliferation, migration, and tumor growth in TNBC cells. (A) PART1 expression (QPCR) following shRNA-induced knockdown in HCC1806 cells (n = 4). Expression is shown normalized to reference genes ARF1 and PUM1 and control cells. Significance was determined by a one-way ANOVA, followed by Dunnett’s post-test for multiple comparisons). Error bars represent SD. (B) The effect of PART1 knockdown on cell proliferation was quantified by counting the relative number of viable cells after 24, 48, and 72 h, using a trypan blue exclusion assay (n = 5, significance determined by a one-way ANOVA, followed by Dunnett’s post-test for multiple comparisons). Error bars represent SEM. (C) NOD/SCID mice were injected with either 10,000 HCC1806 scramble control shRNA clones or HCC1806 PART1 shRNA 1 clone cells (n = 7). Tumor volumes were determined with caliper measurements (l × w2/2) and final tumor weights were determined at termination (significance determined by an unpaired t-test). Error bars represent SEM. (D) Kaplan-Meier survival curves generated by KMplotter. Survival was compared between high vs. low PART1 (probe 205833_s_at) expression groups (where patients were stratified by median expression) in basal-like breast cancer (HR = hazard ratio). (E) QPCR analysis of PART1 expression following PART1-specific GapmeR-mediated knockdown (GapmeR #1 and #2) relative to control GapmeR and reference genes in HCC1806 (ARF1 and PUM1) and in HCC1395 cells (glyceraldehyde-3-phosphate dehydrogenase, GAPDH; beta-2 microglobulin, B2M) (n = 4, error bars represent SD). (F) The effect of GapmeR-mediated PART1 inhibition on cell proliferation was assessed by counting the relative number of viable cells 2 days after treatment using a trypan blue exclusion assay (n = 4, error bars represent SD). (G) The effect of GapmeR-mediated PART1 inhibition on cell migration was assessed by gap closure assay (n = 4). Significance was determined by one-way ANOVA, followed by Dunnett’s post-test for multiple comparisons. Significant p values are indicated as follows in the figures: p < 0.05 = *, p < 0.01 = **. Non-significant p values are either indicated as ns, or not noted.
Figure 3
Figure 3
PART1 is associated with Aldefluorhigh breast CSC populations and its knockdown inhibits mammosphere formation in TNBC. (A) Spearman correlations of PART1 expression with expression of stemness and CSC-associated genes in breast cancer patient tumors in two datasets (TCGA PanCancer Atlas and METABRIC). p values were determined by the cor.test() function with the method argument set to Spearman in Rv4.2. * indicates p value < 0.05. (B) Representative flow cytometry plots of the Aldefluor assay completed on PDX 7482 cells. The Aldefluorhigh (ALDE+) and Aldefluorlow (ALDE-) were sorted. One sample had DEAB (an ALDH inhibitor) to ensure proper identification of the Aldefluorhigh population. PART1 expression in the sorted populations was determined by QPCR and made relative to the Aldefluorlow expression and normalized to reference genes (n = 3, significance was determined using a student’s t-test, error bars represent SD). (CE) PDX 7482 (C), HCC1806 (D), and HCC1395 cells (E) were treated with 15 nM GapmeR in technical triplicates (negative control or PART1-specific GapmeR #1 and 2) and seeded at 5000 cells/well (PDX 7482, n = 3), 3000 cells/well (HCC1806, n = 4), or 4000 cells/well (HCC1395, n = 4) in ultra-low adherence plates. The average number of resulting spheres greater than 50 μm (the length of the scale bar) in diameter per well were counted (representative images are shown). Significance was determined using a one-way ANOVA, followed by Dunnett’s post-test for multiple comparisons (error bars represent SEM). Significant p values are indicated as follows in the figures: p < 0.05 = *, p < 0.01 = **. Non-significant p values are either indicated as ns, or not noted.
Figure 4
Figure 4
PART1 induces gene expression changes in HCC1806 and HCC1395 TNBC cells and is cytoplasmic. (A) Transcriptome changes induced by PART1 knockdown (Gapmer1 (G.1) or Gapmer2 (G.2) versus control GapmeR (control G.) were quantified in HCC1806 and HCC1395 cells using the Affymetrix Human Gene 2.0 ST microarray platform (n = 3). The heatmaps show genes with an expression fold change >1.6 or <−1.6 and a p-value < 0.05 induced by at least one PART1-specific GapmeR. (B) QPCR validation of some genes identified as upregulated by PART1 knockdown (green bars) or downregulated (red bars) by PART1 in (A) (n = 4–7, significance determined by one-way ANOVA, followed by Dunnett’s post-test for multiple comparisons). Error bars represent SD. Expression is normalized relative to the negative control and to reference genes PUM1 and ARF1. (C) The portion of genes (protein coding and non-coding (lncRNA, miRNA, snRNA, pseudogene, misc RNA, snoRNA) covered by the microarray (top) and the portion of genes regulated by PART1 that are in HCC1806 (middle) and HCC1395 (bottom) cells. (D) The LncATLAS [36] database was accessed to determine the relative concentration index (RCI) of PART1 in the nuclear versus cytoplasmic compartments in a panel of cell lines by RNA-seq. Well-established nuclear-localized lncRNA NEAT1 and cytoplasmic-localized lncRNA DANCR are included for comparison. (E) QPCR analysis of lncRNAs DANCR, NEAT1, and PART1 abundance in nuclear and cytoplasmic fractions of HCC1806 cells. Relative expression versus GAPDH is shown (n = 3, significance was determined using student’s t-test). Significant p values are indicated as follows in the figures: p < 0.05 = *, p < 0.01 = **, p < 0.001 = ***. N/D signifies not detected.
Figure 5
Figure 5
PART1 knockdown alters the miRNA landscape in HCC1806 and HCC1935 TNBC cells. (A) TaqMan miRNA assays of miRNAs previously implicated as being sponged by PART1 in non-breast cancer cells were assessed in HCC1806 and HCC1935 cells with or without GapmeR-induced knockdown of PART1 (Gapmer1 (G.1) or Gapmer2 (G.2) versus control GapmeR (control G.) (n = 4–8, significance determined by one-way ANOVA, followed by Dunnett’s post-test for multiple comparisons). Error bars represent SD. miR-129, miR-373-3p, miR-429 and miR-635 levels were quantified by the TaqMan miRNA assays and the expression is normalized to reference miRNAs RNU48 and miR-221. miR-190a-3p levels were quantified by the TaqMan miRNA Advanced assays and expression is normalized to reference miRNAs miR-21-5p and miR-26b-5p. (B) The heatmaps show miRNAs with an expression fold change ≥1.3 or ≤−1.3 and within the top 75th percentile for the number of common mRNA targets with PART1 regulated mRNAs (corresponding to at least 15 common genes in HCC1806s cells and 9 in HCC1395 cells) induced by at least one PART1-specific GapmeR. (C) The abundance of all the miRNAs in the 4.0 miRNA gene chip array relative to PART1 (abundance extrapolated from File S2) detected in the in the negative control samples were calculated for HCC1806 and HCC1395 cells (average of 3n). (D) TaqMan miRNA advanced assays of some of the miRNAs identified as being upregulated or downregulated by PART1 knockdown in HCC1806 of HCC1935 cells in the gene chip array in (C) (n = 7–8, significance determined by one-way ANOVA, followed by Dunnett’s post-test for multiple comparisons, and expression is normalized to reference miRNAs miR-21-5p and miR-26b-5p). Significant p values are indicated as follows in the figures: p < 0.05 = *, p < 0.01 = **, p < 0.0001 = ****.
Figure 6
Figure 6
The PART1-miRNA-mRNA network in TNBC cells. (A) The LncBase v2 predicted PART1 binding sites and affinity threshold score of miR-937-5p. (B) Relative luciferase activity generated by HCC1806 cells transfected with pmirGLO dual-luciferase miRNA target expression vector bearing the predicted PART1 target sequence for miR-937-5p (wildtype, WT) or a mutated version (MUT), and also treated with mimic-hsa-miR-937-5p or mimic negative control (n = 3, significance determined by one-way ANOVA, followed by Dunnett’s post-test for multiple comparisons). Luciferase activity is made relative to the cells treated with the mimic negative control and bearing the WT sequence vector. (C) Venn diagrams visualize the number of PART1 regulated genes that are predicted miRNA targets. (D) Pie charts depict the proportion of PART1 regulated mRNAs that are potentially regulated by the miRNAs identified to interact with PART1. (E) The network node analysis visualizes the PART1-regulated miRNAs miR-937-5p, miR-30b-3p and miR-6870-5p in HCC1806 cells and miR-190a-3p, miR-22-5p, miR-30b-3p and miR-6870-5p in HCC1395 cells connected with PART1-regulated mRNAs. Significant p values are indicated as follows in the figures: p < 0.01 = **. Non-significant p values are either indicated as ns, or not noted.

References

    1. Pandya G., Kirtonia A., Sethi G., Pandey A.K., Garg M. The implication of long non-coding RNAs in the diagnosis, pathogenesis and drug resistance of pancreatic ductal adenocarcinoma and their possible therapeutic potential. Biochim. Biophys. Acta Rev. Cancer. 2020;1874:188423. doi: 10.1016/j.bbcan.2020.188423. - DOI - PubMed
    1. Kansara S., Pandey V., Lobie P.E., Sethi G., Garg M., Pandey A.K. Mechanistic Involvement of Long Non-Coding RNAs in Oncotherapeutics Resistance in Triple-Negative Breast Cancer. Cells. 2020;9:1511. doi: 10.3390/cells9061511. - DOI - PMC - PubMed
    1. Rinn J.L., Chang H.Y. Genome regulation by long noncoding RNAs. Annu. Rev. Biochem. 2012;81:145–166. doi: 10.1146/annurev-biochem-051410-092902. - DOI - PMC - PubMed
    1. Prensner J.R., Chinnaiyan A.M. The Emergence of lncRNAs in Cancer Biology. Cancer Discov. 2011;1:391–407. doi: 10.1158/2159-8290.CD-11-0209. - DOI - PMC - PubMed
    1. Vidovic D., Huynh T.T., Konda P., Dean C., Cruickshank B.M., Sultan M., Coyle K.M., Gujar S., Marcato P. ALDH1A3-regulated long non-coding RNA NRAD1 is a potential novel target for triple-negative breast tumors and cancer stem cells. Cell Death Differ. 2019 doi: 10.1038/s41418-019-0362-1. - DOI - PMC - PubMed

LinkOut - more resources