. 2021 May 29;11(6):725.
doi: 10.3390/brainsci11060725.

Dopamine System, NMDA Receptor and EGF Family Expressions in Brain Structures of Bl6 and 129Sv Strains Displaying Different Behavioral Adaptation

Affiliations

Dopamine System, NMDA Receptor and EGF Family Expressions in Brain Structures of Bl6 and 129Sv Strains Displaying Different Behavioral Adaptation

Jane Varul et al. Brain Sci. .

Abstract

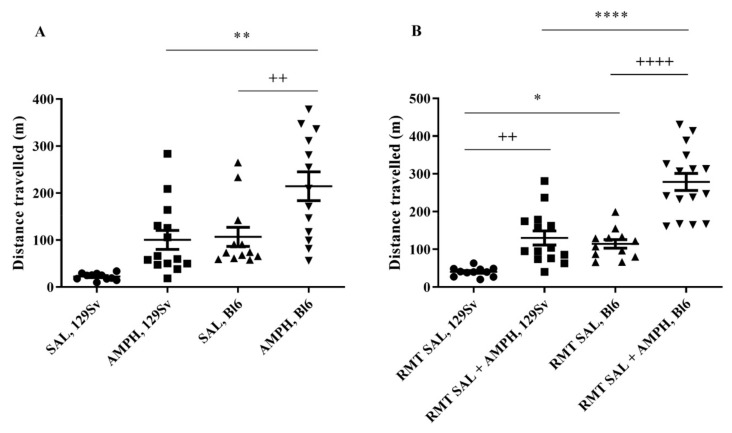
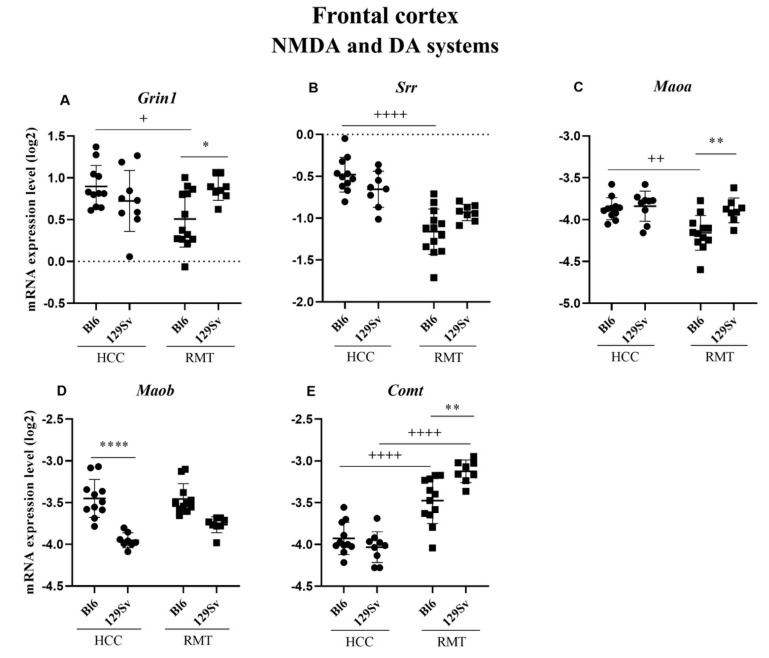
C57BL/6NTac (Bl6) and 129S6/SvEvTac (129Sv) mice display different coping strategies in stressful conditions. Our aim was to evaluate biomarkers related to different adaptation strategies in the brain of male 129Sv and Bl6 mice. We focused on signaling pathways related to the dopamine (DA) system, N-methyl-D-aspartate (NMDA) receptor and epidermal growth factor (EGF) family, shown as the key players in behavioral adaptation. Mice from Bl6 and 129Sv lines were divided into either home cage controls (HCC group) or exposed to repeated motility testing and treated with saline for 11 days (RMT group). Distinct stress responses were reflected in severe body weight loss in 129Sv and the increased exploratory behavior in Bl6 mice. Besides that, amphetamine caused significantly stronger motor stimulation in Bl6. Together with the results from gene expression (particularly Maob), this study supports higher baseline activity of DA system in Bl6. Interestingly, the adaptation is reflected with opposite changes of DA markers in dorsal and ventral striatum. In forebrain, stress increased the gene expressions of Egf-Erbb1 and Nrg1/Nrg2-Erbb4 pathways more clearly in 129Sv, whereas the corresponding proteins were significantly elevated in Bl6. We suggest that not only inhibited activity of the DA system, but also reduced activity of EGF family and NMDA receptor signaling underlies higher susceptibility to stress in 129Sv. Altogether, this study underlines the better suitability of 129Sv for modelling neuropsychiatric disorders than Bl6.

Keywords: 129Sv strain; Bl6 strain; EGF family; NMDA receptor; adaptation; dopamine system; gene expression; stress model.


Conflict of interest statement

The authors declare that the research was conducted in the absence of any commercial or financial relationships that could be construed as a potential conflict of interest.

Figures

Figure 1
Figure 1
Measured gene expression from three large neurotransmitter/neuromodulator systems. More detailed information concerning full names and primers for genes is presented in Table S2.
Figure 2
Figure 2
Schematic overview of the experimental design for gene expression measurement. Two batches of male 129Sv and Bl6 mice were used in this study. One batch (Bl6; n = 12 and 129Sv; n = 12) was used as home cage controls (HCCs). The other batch (Bl6; n = 16 and 129Sv; n = 14) was subjected to repeated motility testing (RMT batch). HCCs were weighed twice: on the 1st day and on the 11th day. In the RMT batch, on test days 1–11 the following routine was used: animals were weighed (BW measurement), 0.9% saline (SAL) solution was administered i.p. (SAL injection) and animals were placed for 30 min into single housing. After 30 min of single housing, animals were placed into the sound-proof motility boxes (MB) for 30 min for locomotor activity measurement and then returned to home-cages.
Figure 3
Figure 3
Change in body weight during the experimental period. Two-way ANOVA was applied to demonstrate differences between the strains and environments. Bonferroni post hoc analysis after significant two-way ANOVA: * p ≤ 0.05, **** p ≤ 0.0001 compared to respective 129Sv mice, +++ p ≤ 0.001 and ++++ p ≤ 0.0001 strain specific comparison. Data are expressed as mean values ± SD. Number of animals in each group varied from 12 to 16.
Figure 4
Figure 4
Changes in locomotor activity of Bl6 and 129Sv mice during repeated motility testing. Bl6 mice were more active both in terms of (A) distance travelled and (B) number of rearings. The difference in vertical activity between strains became augmented with each subsequent repeated testing. Data are presented as mean values ± SD. Bonferroni post hoc analysis after significant repeated measures ANOVA: ** p ≤ 0.01, *** p ≤ 0.001 and **** p ≤ 0.0001 compared to the respective 129Sv mice; +++ p ≤ 0.001 (compared to Bl6 on the 1st day of study). Number of animals in each group varied from 11 to 12.
Figure 5
Figure 5
The effect of acute amphetamine (AMPH, 3 mg/kg) treatment in the beginning and at the end of RMT in Bl6 and 129Sv strains. (A) AMPH treatment in the beginning of study (HCC) and (B) AMPH treatment after repeated saline administrations (RMT). AMPH was administered 30 min before the beginning of motility test and distance travelled was measured for 30 min. Data are presented as mean values ± SD. Bonferroni post hoc analysis after significant two-way ANOVA: * p ≤ 0.05, ** p ≤ 0.01 and **** p ≤ 0.0001 compared to the respective 129Sv mice, ++ p ≤ 0.01 and ++++ p ≤ 0.0001 strain specific comparison. SAL—saline. Number of animals in each group varied from 11 to 16.
Figure 6
Figure 6
NMDA and DA systems gene expression in the frontal cortex of Bl6 and 129Sv mice. Two-way ANOVA was applied to demonstrate differences between the strains and environments. Substantial statistically significant gene expressions for (A) Grin1—glutamate ionotropic receptor NMDA type subunit 1, (B) Srr—serine racemase, (C) Maoa—monoamine oxidase A, (D) Maob—monoamine oxidase B and (E) Comt—catechol-O- methyltransferase. Bonferroni post hoc test: * p ≤ 0.05, ** p ≤ 0.01 and **** p ≤ 0.0001 compared to respective 129Sv mice; + p ≤ 0.05, ++ p ≤ 0.01 and ++++ p ≤ 0.0001 in strain specific comparison. Data are expressed as mean values ± SD. Number of animals in each group varied from 8 to 14.
Figure 7
Figure 7
NMDA and DA systems gene expression in the hippocampus of Bl6 and 129Sv mice. Two-way ANOVA was applied to demonstrate differences between the strains and environments. Substantial statistically significant gene expressions for (A) Grin1—glutamate ionotropic receptor NMDA type subunit 1, (B) Grin2b—glutamate ionotropic receptor NMDA type subunit 2B, (C) Srr—serine racemase, (D) Drd1—dopamine receptor D1, (E) Maoa—monoamine oxidase A and (F) Maob—monoamine oxidase B. Bonferroni post hoc test: * p ≤ 0.05, ** p ≤ 0.01 and **** p ≤ 0.0001 compared to the respective 129Sv mice, ++ p ≤ 0.01 and ++++ p ≤ 0.0001 in strain specific comparison. Data are expressed as mean values ± SD. Number of animals in each group varied from 7 to 13.
Figure 8
Figure 8
DA system gene expression in ventral striatum of Bl6 and 129Sv mice. Two-way ANOVA was applied to demonstrate differences between the strains and environments. Substantial statistically significant gene expressions for (A) Drd2—dopamine receptor D2, (B) Drd4—dopamine receptor D4, (C) Th—tyrosine hydroxylase, (D) Comt—catechol-O- methyltransferase, (E) Maoa—monoamine oxidase A and (F) Maob—monoamine oxidase B. Bonferroni post hoc test: ** p ≤ 0.01 compared to respective 129Sv mice, + p ≤ 0.05, ++ p ≤ 0.01, +++ p ≤ 0.001 and ++++ p ≤ 0.0001 in strain specific comparison. Data are expressed as mean values ± SD. Number of animals in each group varied from 7 to 11.
Figure 9
Figure 9
NMDA and DA systems gene expression in dorsal striatum of Bl6 and 129Sv mice. Two-way ANOVA was applied to demonstrate differences between the strains and environments. Substantial statistically significant gene expressions for (A) Grin1—glutamate ionotropic receptor NMDA type subunit 1, (B) Grin2a—glutamate ionotropic receptor NMDA type subunit 2A, (C) Srr—serine racemase, (D) Drd1—dopamine receptor D1, (E) Drd2—dopamine receptor D2 and (F) Maob—monoamine oxidase B. Bonferroni post hoc test: **** p ≤ 0.0001 compared to respective 129Sv mice, ++ p ≤ 0.01, +++ p ≤ 0.001 and ++++ p ≤ 0.0001 in strain specific comparison. Data are expressed as mean values ± SD. Number of animals in each group varied from 7 to 13.
Figure 10
Figure 10
Egf family gene expression in the frontal cortex of Bl6 and 129Sv mice. Two-way ANOVA was applied to demonstrate differences between the strains and environments. Substantial statistically significant gene expressions for (A) Egf—epidermal growth factor, (B) Tgfa—transforming growth factor alpha, (C) Nrg1—neuregulin 1, (D) Nrg2—neuregulin 2, (E) Erbb1—epidermal growth factor receptor and (F) Erbb4—Erb–b2 receptor tyrosine kinase 4. Bonferroni post hoc test: * p ≤ 0.05 and **** p ≤ 0.0001 compared to respective 129Sv mice, + p ≤ 0.05, ++ p ≤ 0.01 and ++++ p ≤ 0.0001 in strain specific comparison. Data are expressed as mean values ± SD. Number of animals in each group varied from 8 to 13.
Figure 11
Figure 11
Egf family gene expression in the hippocampus of Bl6 and 129Sv mice. Two-way ANOVA was applied to demonstrate differences between the strains and environments. Substantial statistically significant gene expressions for (A) Egf—epidermal growth factor, (B) Nrg1—neuregulin 1, (C) Nrg2—neuregulin 2, (D) Nrg3—neuregulin 3, (E) Erbb1—epidermal growth factor receptor and (F) Erbb4—erb–b2 receptor tyrosine kinase 4. Bonferroni post hoc test: * p ≤ 0.05, ** p ≤ 0.01 *** p ≤ 0.001 and **** p ≤ 0.0001 compared to respective 129Sv mice, +++ p ≤ 0.001 and ++++ p ≤ 0.0001 in strain specific comparison. Data are expressed as mean values ± SD. Number of animals in each group varied from 7 to 13.
Figure 12
Figure 12
Egf family gene expression in ventral striatum of Bl6 and 129Sv mice. Two-way ANOVA was applied to demonstrate differences between the strains and environments. Substantial statistically significant gene expressions for (A) Egf—epidermal growth factor, (B) Nrg1—neuregulin 1, (C) Nrg3—neuregulin 3 and (D) Erbb1—epidermal growth factor receptor. Bonferroni post hoc test: * p ≤ 0.05 compared to respective 129Sv mice, ++ p ≤ 0.01, +++ p ≤ 0.001 and ++++ p ≤ 0.0001 in strain specific comparison. Data are expressed as mean values ± SD. Number of animals in each group varied from 7 to 11.
Figure 13
Figure 13
Egf family gene expression in dorsal striatum of Bl6 and 129Sv mice. Two-way ANOVA was applied to demonstrate differences between the strains and environments. Substantial statistically significant gene expressions for (A) Egf—epidermal growth factor, (B) Nrg1—neuregulin 1, (C) Nrg3—neuregulin 3 and (D) Erbb1—epidermal growth factor receptor. Bonferroni post hoc test: * p ≤ 0.05 and ** p ≤ 0.01 compared to respective 129Sv mice, ++++ p ≤ 0.0001 in strain specific comparison. Data are expressed as mean values ± SD. Number of animals in each group varied from 8 to 13.
Figure 14
Figure 14
Protein expression in the hippocampus of Bl6 and 129Sv mice. Unpaired t-test with Welch’s correction was applied to demonstrate differences between the strains in HCC group. Substantial statistically significant protein expressions for (A) EGF—epidermal growth factor, (B) ERBB1—epidermal growth factor receptor, (C) NRG1—neuregulin 1, (D) NRG2—neuregulin 2, (E) GRIN1—glutamate ionotropic receptor NMDA type subunit 1, and (F) representative immunoblots. Unpaired t-test with Welch’s correction: * p ≤ 0.05, ** p ≤ 0.01 between the strains. Data are expressed as mean values ± SD. Number of animals in each group varied from 5–6.
Figure 15
Figure 15
Protein expression in the frontal cortex of Bl6 and 129Sv mice. Kruskal-Wallis test was applied to demonstrate differences between the strains and environments. Substantial statistically significant protein expressions for (A) EGF—epidermal growth factor, (B) ERBB1—epidermal growth factor receptor, (C) NRG1—neuregulin 1, (D) NRG2—neuregulin 2, (E) GRIN1—glutamate ionotropic receptor NMDA type subunit 1, and (F) representative immunoblots. Dunn’s multiple comparison test: ++ p ≤ 0.01, +++ p ≤ 0.001 in strain specific comparison. Data are expressed as mean values ± SD. Number of animals in each group varied from 5–6.

Similar articles

Cited by

References

    1. Abramov U., Puussaar T., Raud S., Kurrikoff K., Vasar E. Behavioural Differences between C57BL/6 and 129S6/SvEv Strains Are Reinforced by Environmental Enrichment. Neurosci. Lett. 2008;443:223–227. doi: 10.1016/j.neulet.2008.07.075. - DOI - PubMed
    1. Contet C., Rawlins J.N.P., Bannerman D.M. Faster Is Not Surer—A Comparison of C57BL/6J and 129S2/Sv Mouse Strains in the Watermaze. Behav. Brain Res. 2001;125:261–267. doi: 10.1016/S0166-4328(01)00295-9. - DOI - PubMed
    1. Heinla I., Leidmaa E., Visnapuu T., Philips M.-A., Vasar E. Enrichment and Individual Housing Reinforce the Differences in Aggressiveness and Amphetamine Response in 129S6/SvEv and C57BL/6 Strains. Behav. Brain Res. 2014;267:66–73. doi: 10.1016/j.bbr.2014.03.024. - DOI - PubMed
    1. Võikar V., Kõks S., Vasar E., Rauvala H. Strain and Gender Differences in the Behavior of Mouse Lines Commonly Used in Transgenic Studies. Physiol. Behav. 2001;72:271–281. doi: 10.1016/S0031-9384(00)00405-4. - DOI - PubMed
    1. Belknap J.K., Crabbe J.C., Young E.R. Voluntary Consumption of Ethanol in 15 Inbred Mouse Strains. Psychopharmacology. 1993;112:503–510. doi: 10.1007/BF02244901. - DOI - PubMed