Review
. 2021 May 29;13(6):1027.
doi: 10.3390/v13061027.

Structural and Biophysical Characterization of the HCV E1E2 Heterodimer for Vaccine Development

Affiliations
Review

Structural and Biophysical Characterization of the HCV E1E2 Heterodimer for Vaccine Development

Eric A Toth et al. Viruses. .

Abstract

An effective vaccine for the hepatitis C virus (HCV) is a major unmet medical and public health need, and it requires an antigen that elicits immune responses to multiple key conserved epitopes. Decades of research have generated a number of vaccine candidates; based on these data and research through clinical development, a vaccine antigen based on the E1E2 glycoprotein complex appears to be the best choice. One bottleneck in the development of an E1E2-based vaccine is that the antigen is challenging to produce in large quantities and at high levels of purity and antigenic/functional integrity. This review describes the production and characterization of E1E2-based vaccine antigens, both membrane-associated and a novel secreted form of E1E2, with a particular emphasis on the major challenges facing the field and how those challenges can be addressed.

Keywords: E1; E1E2 glycoprotein complex; E2; biophysical characterization; envelope glycoproteins; hepatitis C virus (HCV); protein expression; protein purification; secreted E1E2; vaccine design.


Conflict of interest statement

The authors declare no conflict of interest.

Figures

Figure 1
Figure 1
Structures of the E1 and E2 glycoproteins. (A) The structure of a truncated E1 glycoprotein ectodomain (PDB: 4UOI), with resolved residues encompassing positions 192–270. An E1 monomer (slate; surface and cartoon representation) is shown with a second E1 monomer (gray) representing the dimeric partner from the X-ray structure assembly. (B) The truncated E2 glycoprotein ectodomain structure (PDB: 6MEJ), encompassing E2 residues 405–645, showing the E2 neutralizing face and antigenic domains B, D, and E. Representative residues from the antigenic domains are colored as indicated by the letters, and resolved residues from hypervariable region 1 (HVR1) (residues 405–410) are colored gray. Other residues in E2 are colored tan. (C) The same E2 glycoprotein structure as in (B), reoriented to show antigenic domains A and C (colored by representative residues and labeled). Bound antibodies HEPC3 (antigenic domain B antibody) and HEPC46 (antigenic domain C antibody), both in gray cartoon, are shown for reference. The neutralizing face is colored as in panel (B).
Figure 2
Figure 2
Expression and processing of mbE1E2. (top) Schematic of the E1E2 signal peptide (SP) plus polyprotein expression construct. (bottom) Processing pathway for the N-terminal portion of the HCV polyprotein. Signal peptidase cleavages release E1 and E2 (black and gray arrows). Signal peptide peptidase (SPP) cleavage of HCV core is indicated by a dark blue arrow. Repositioning of E1 and E2 transmembrane domains (TMDs) is indicated by curved arrows. Glycans attached to E1 and E2 are depicted as branched structures. Adapted from [74].
Figure 3
Figure 3
Optimization of expression and purification. (A) Relative expression of mbE1E2 in HEK 293F cells (Lanes 1 and 3) versus Expi293F cells (Lanes 2 and 4) analyzed by Western blotting probed with the anti-E2 antibody HCV1. A standard of 250 ng of sE2 is included as a reference (Lane 5). The relative expression levels of the constructs based on quantification of band intensity are 0.26 for Lane 1, 0.81 for Lane 2, 0.09 for Lane 3, 0.31 for Lane 4, and 1.0 for the standard in Lane 5. (B) mbE1E2 purified as described in [25] and analyzed by silver-stained SDS-PAGE.
Figure 4
Figure 4
Analysis of HCV E1 trimer formation in different platforms. Nondenaturing (or denaturing, as indicated) Western blot for HCVcc (left), HCVpp (middle), and purified mbE1E2 (right) using the antibodies indicated in each panel. Molecular mass markers (in kilodaltons) are indicated on the right. The oligomeric forms of E1 are indicated on the left. The left and middle panels are reproduced with permission from [116]. In the right panel, duplicate and/or irrelevant lanes between the displayed sample and the marker were deleted for the sake of clarity (indicated by a vertical line).
Figure 5
Figure 5
Analysis of purified recombinant mbE1E2. (A) SEC profile of mbE1E2 purified from Expi293 cell extracts (B) Reducing anti-E2 Western blot analysis of eluted fractions. (C) Reducing anti-E1 Western blot analysis of eluted fractions. Molecular weights, in kDa, of the Western blot markers closest to observed bands are indicated on the left panels of (B) and (C). Reproduced in modified form with permission from [22].
Figure 6
Figure 6
Analysis of mbE1E2 by analytical ultracentrifugation. Shown is the distribution of Lamm equation solutions c(s) for mbE1E2 (blue). The coefficients for the peaks are shown. Reproduced with permission from [22].
Figure 7
Figure 7
mbE1E2 characterized with SEC-MALS and compared with molecular weight standards. The SEC-MALS chromatograph of mbE1E2 is shown as a blue line. The range of elution volumes within the peak half-maximum is shown as red dots, with the size distribution labeled and enclosed in parentheses. An estimation of molecular weight at the center of the peak is indicated. Molecular weight standards are shown as a grey line corresponding to sizes of 670, 158, 44, 17, and 1.35 kDa. Reproduced with permission from [22].
Figure 8
Figure 8
Disulfide bond configuration observed in the E2 ectodomain structure (RCSB ID 6MEI). The numbering shown corresponds to genotype 1b strain 1b09.
Figure 9
Figure 9
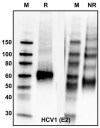
Analysis of purified mbE1E2 by reducing (R) and nonreducing (NR) Western blots. Both blots were probed with the anti-E2 antibody HCV1.
Figure 10
Figure 10
(A). Stability analysis of purified mbE1E2 based on temperature-dependent binding to mAbs. Samples were incubated at 25 °C (blue), 37 °C (orange), or 56 °C (gray) for one hour prior to the experiment. (B). DLS analysis of mbE1E2 formulated with an adjuvant using two different storage regimens. The size distribution by volume of the adjuvant alone (blue dotted lines) and the two formulations (tan and brown solid lines) is shown.
Figure 11
Figure 11
Design of selected sE1E2 constructs. (A). Schematic of sE1E2GS3. (B). Schematic of sE1E2.R6. (C). Schematic of sE1E2.LZ and the X-ray structure of the human c-Fos/c-Jun heterodimer (PDB code: 1FOS); only the coiled-coil region that was used for the sE1E2.LZ scaffold is shown. c-Fos and c-Jun chains were colored to match the diagram of sE1E2.LZ. Regions shown include the tPA signal sequence (green), E1 ectodomain (cyan), E2 ectodomain (orange), Gly-Ser linker (yellow), and c-Fos and c-Jun scaffolds (magenta and blue). Location of the His tag (gray) and furin cleavage site (red) is indicated where applicable. E1E2 residue ranges for each region are noted according to H77 numbering.
Figure 12
Figure 12
Analytical characterization of sE1E2.LZ heterogeneity. (A) AUC profile of purified sE1E2.LZ. Shown is the distribution of Lamm equation solutions c(s) for sE1E2.LZ (blue line). Calculated sedimentation coefficients for the peaks are labeled. Observed species for sE1E2.LZ approximately correspond to a heterodimer at 5.1 S, a dimer of heterodimers at 8.1 S, and higher-order aggregates at >10 S. (B) sE1E2.LZ characterized with SEC-MALS and compared with molecular weight standards. The SEC-MALS chromatograph of sE1E2.LZ is shown as a blue line. A range of elution volumes within the peak half-maximum is shown as red dots, with the size distribution of each range labeled and enclosed in parentheses. An estimation of molecular weight at the center of each peak is indicated. Molecular weight standards are shown as a grey line corresponding to values of 670, 158, 44, 17, and 1.35 kDa. Reproduced with permission from [22].

Similar articles

Cited by

References

    1. WHO . Global Hepatitis Report 2017. World Health Organization; Geneva, Switzerland: 2017.
    1. Ly K.N., Hughes E.M., Jiles R.B., Holmberg S.D. Rising Mortality Associated With Hepatitis C Virus in the United States, 2003–2013. Clin. Infect. Dis. 2016;62:1287–1288. doi: 10.1093/cid/ciw111. - DOI - PMC - PubMed
    1. Cox A.L. MEDICINE. Global control of hepatitis C virus. Science. 2015;349:790–791. doi: 10.1126/science.aad1302. - DOI - PubMed
    1. Fauvelle C., Colpitts C.C., Keck Z.Y., Pierce B.G., Foung S.K., Baumert T.F. Hepatitis C virus vaccine candidates inducing protective neutralizing antibodies. Expert Rev. Vaccines. 2016;15:1535–1544. doi: 10.1080/14760584.2016.1194759. - DOI - PMC - PubMed
    1. Walker C.M., Grakoui A. Hepatitis C virus: Why do we need a vaccine to prevent a curable persistent infection? Curr. Opin. Immunol. 2015;35:137–143. doi: 10.1016/j.coi.2015.06.010. - DOI - PMC - PubMed

Publication types