

The Use of Non-Nutritive and Low-Calorie Sweeteners in 19,915 Local and Imported Pre-Packaged Foods in Hong Kong
- PMID: 34072564
- PMCID: PMC8229473
- DOI: 10.3390/nu13061861
The Use of Non-Nutritive and Low-Calorie Sweeteners in 19,915 Local and Imported Pre-Packaged Foods in Hong Kong
Abstract
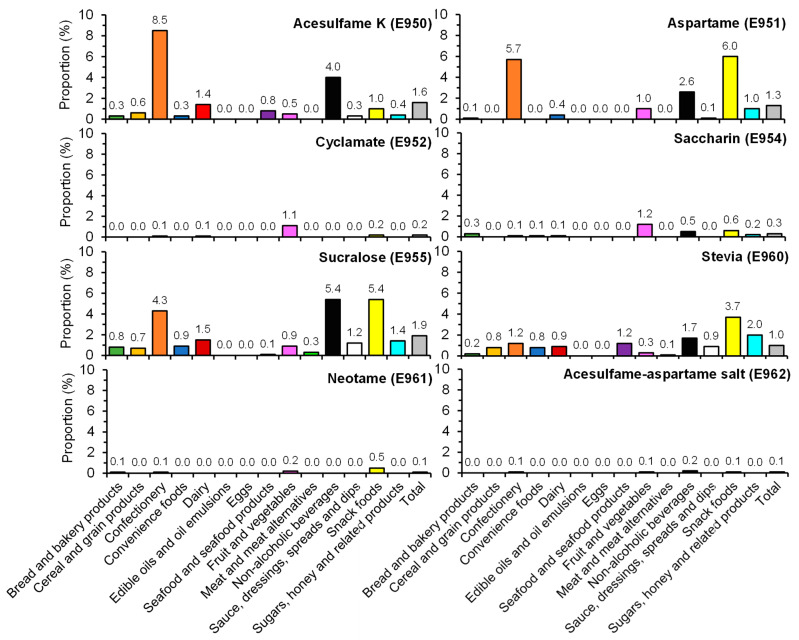
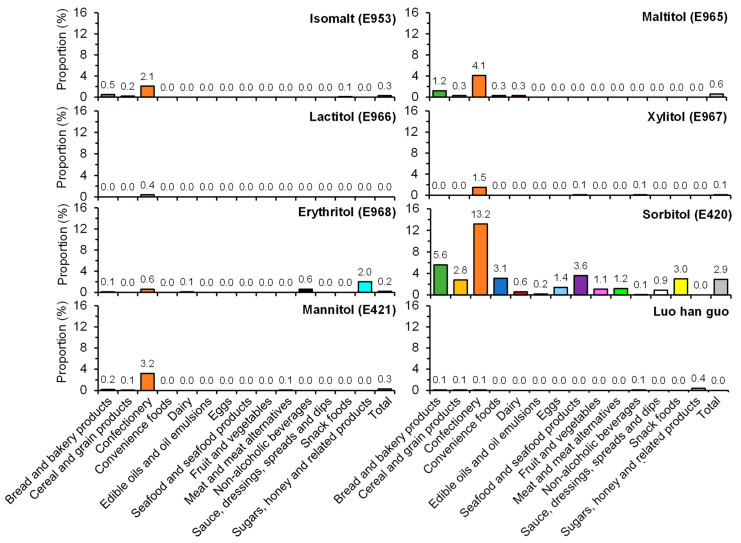
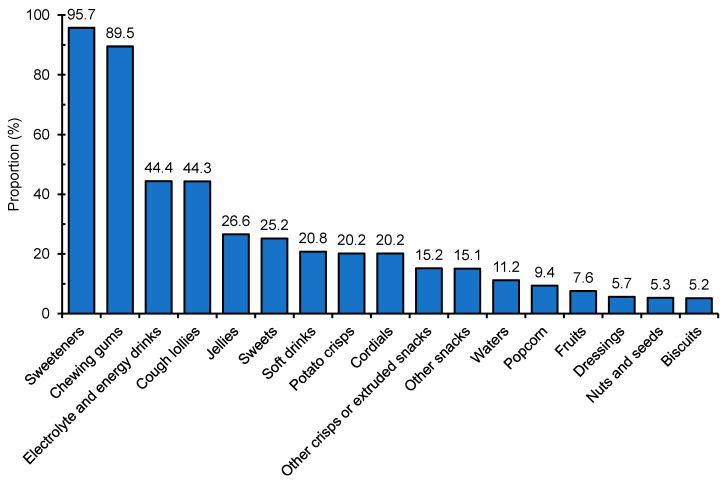
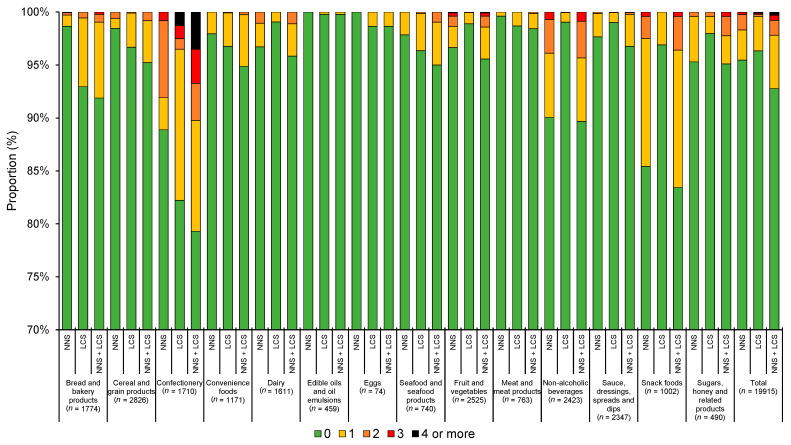
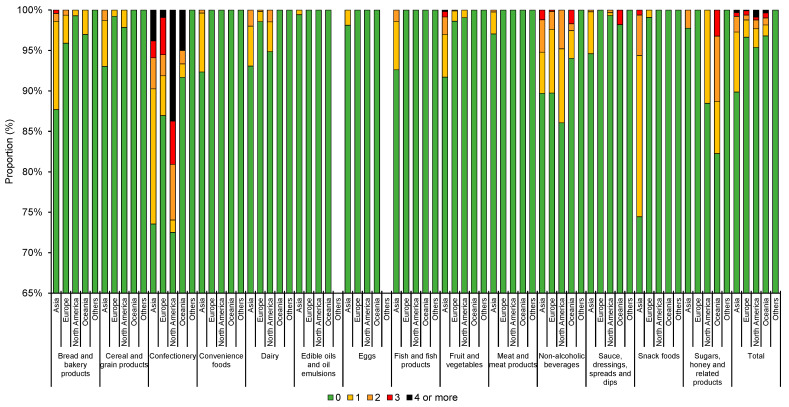
This study aims to examine the use of non-nutritive (NNSs) and low-calorie sweeteners (LCSs) in pre-packaged foods in Hong Kong and the differences in the number of NNSs/LCSs used between products from different regions. In a cross-sectional audit, the types of NNSs/LCSs used in 19,915 pre-packaged foods in Hong Kong were examined by searching the ingredients list of the included products for keywords related to 20 common NNSs/LCSs and their respective E-numbers. Prevalence of use of NNSs and LCSs, the co-presence of NNSs/LCSs and free sugar ingredients (FSI), and the number of NNSs/LCSs used in the included foods were computed. Pearson's χ2 test was used to compare the total number of NNSs and/or LCSs used in food items from different regions. Sucralose (E955) was the most commonly used NNS (1.9%), followed by acesulfame K (E950, 1.6%). Sorbitol was the most commonly used LCS (2.9%). Overall, the use of LCSs was less common compared with NNSs (3.7% vs. 4.5%). The use of different types of NNSs varied substantially between food types. Notably, 20.2% of potato crisps and 15.2% of other crisps or extruded snacks contained at least one NNS and/or LCS. Co-presence of FSIs and NNSs/LCSs were most common in confectionery (15.7%) and snack foods (15.5%). Asian prepackaged foods were more likely to contain NNSs/LCSs (10.1%) compared with those from other regions. To conclude, NNSs/LCSs were used in a wide range of non-diet pre-packaged products which could be a public health concern due to their higher consumption frequencies than "diet" products.
Keywords: Hong Kong; intense sweeteners; low-calorie sweeteners; non-nutritive sweeteners; pre-packaged foods; sugar substitutes.
Conflict of interest statement
The authors declare no conflict of interest.
Figures
References
-
- World Health Organization . In: Guideline: Sugar Intake for Adults and Children. WHO Department of Nutrition for Health and Development (NHD), editor. WHO; Geneva, Switzerland: 2015. p. 50.
-
- Public Health England . Sugar Reduction: Achieving the 20%. A Technical Report Outlining Progress to Date, Guidelines for Industry, 2015 Baseline Levels in Key Foods and Next Steps. Public Health England; London, UK: 2017.
MeSH terms
Substances
LinkOut - more resources
Full Text Sources
