. 2021 May 31;22(11):5890.
doi: 10.3390/ijms22115890.

Virus-Host Interaction Gets Curiouser and Curiouser. PART I: Phage P1 vir Enhanced Development in an E. coli DksA-Deficient Cell

Affiliations

Virus-Host Interaction Gets Curiouser and Curiouser. PART I: Phage P1 vir Enhanced Development in an E. coli DksA-Deficient Cell

Grzegorz M Cech et al. Int J Mol Sci. .

Abstract

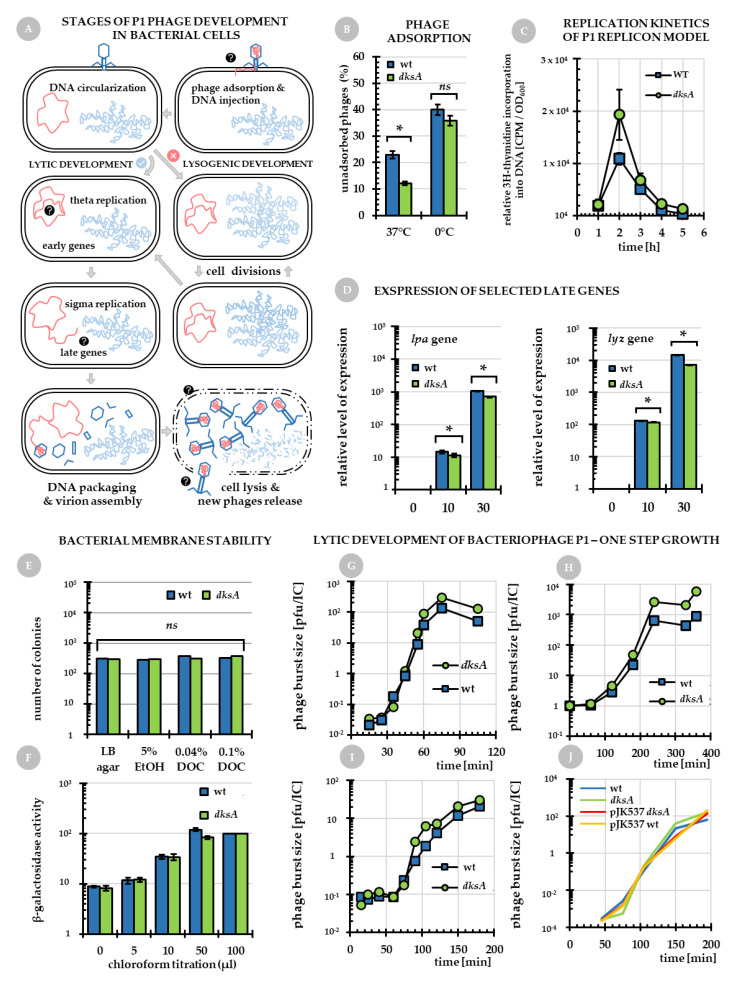
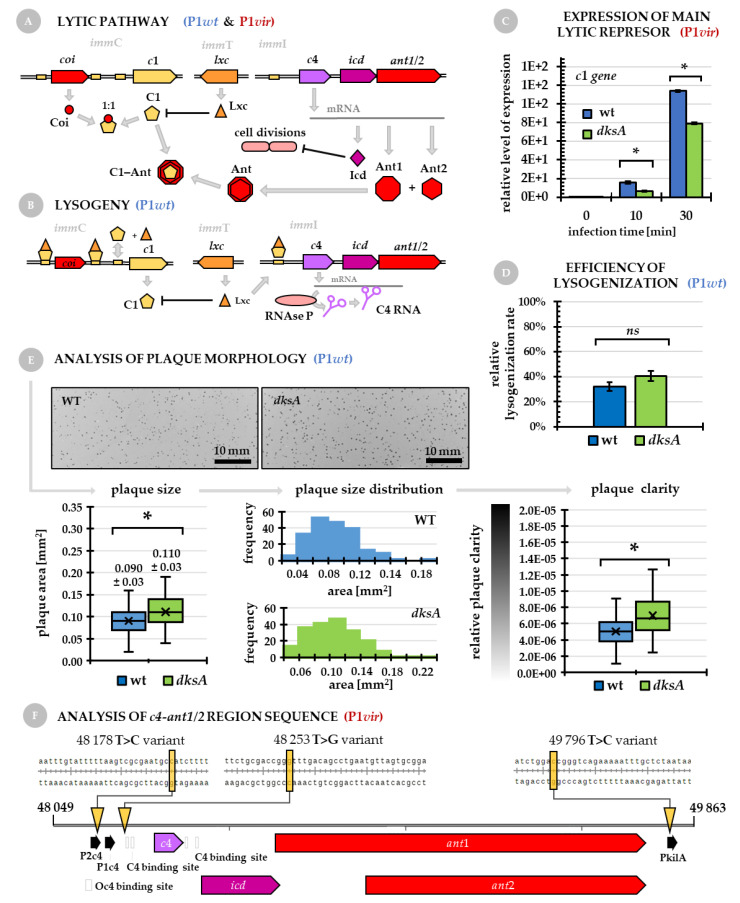
Bacteriophage P1 is among the best described bacterial viruses used in molecular biology. Here, we report that deficiency in the host cell DksA protein, an E. coli global transcription regulator, improves P1 lytic development. Using genetic and microbiological approaches, we investigated several aspects of P1vir biology in an attempt to understand the basis of this phenomenon. We found several minor improvements in phage development in the dksA mutant host, including more efficient adsorption to bacterial cell and phage DNA replication. In addition, gene expression of the main repressor of lysogeny C1, the late promoter activator Lpa, and lysozyme are downregulated in the dksA mutant. We also found nucleotide substitutions located in the phage immunity region immI, which may be responsible for permanent virulence of phage P1vir. We suggest that downregulation of C1 may lead to a less effective repression of lysogeny maintaining genes and that P1vir may be balancing between lysis and lysogeny, although finally it is able to enter the lytic pathway only. The mentioned improvements, such as more efficient replication and more "gentle" cell lysis, while considered minor individually, together may account for the phenomenon of a more efficient P1 phage development in a DksA-deficient host.

Keywords: DksA; P1 phage; P1vir bacteriophage; host-virus interactions; lytic development.


Conflict of interest statement

The authors declare no conflict of interest.

Figures

Figure A1
Figure A1
Typical growth of E. coli wild type (blue squares) and dksA (green circles) strains in the LB medium at 37 °C—an additional information for Figure 2C. Presented results are mean values from FIVE independent experiments with error bars representing SD. Labels denote the value of optical density measured at 600 nm (OD600) at each time point for each strain.
Figure 1
Figure 1
Bacteriophage P1vir plaques morphology. The same number of phage particles (102–103 phages per plate) was added to the top agar containing wild type or dksA cells. (A) Representative pictures of plaque morphology obtained for the wild type and dksA mutant strains. (B) Calculated P1vir plaque sizes when developing on either strain (results are presented as mean ± SD, whiskers show max and min values, black line across boxes represents the median). (C) Distribution of plaque sizes for both infected strains. Note different values on the x-axis for each strain. Data were collected from at least 100 plaques obtained in at least three independent biological replicates per strain. Statistical significance was tested with the Mann–Whitney U test; (*) marks significant differences with p-value ≤ 0.05.
Figure 2
Figure 2
Analysis of selected aspects of P1vir phage biology in different hosts. (A) General overview of P1 phage development in E. coli. Question marks denote hypothetical points in phage/host biology where changes may lead to the observed phenomenon of improved P1vir development in a dksA mutant vs. the wild type strain. These points were experimentally verified and the results are shown in following panels. (B) Efficiency of P1 phage adsorption on wild type (blue columns) and dksA (green columns) strains presented as percentage of unadsorbed phages at indicated temperatures. (C) The efficiency of pSP102 DNA synthesis, a bacteriophage P1 replicon (the experiment was performed during the exponential phase of growth; compare Figure A1). Panel (D) shows expression levels of phage genes encoding late promoter activator (lpa) and lysozyme (lyz) during P1vir infection of the wild type and dksA mutant cells. Gene expression at 10 min and 30 min of infection was compared to time 0 in the corresponding strains (note the log expression scales). (E,F) Data obtained for the host membrane stability tests. (E) Colony formation efficiency of the wild type and dksA strains. Bacteria were cultured in LB and then were diluted and plated on LB agar plates containing indicated concentrations of ethanol (EtOH) or sodium deoxycholate (DOC). (F) The relative β-galactosidase activity of the wild type and dksA strains treated with different amounts of chloroform. β-galactosidase activity that was assessed in samples treated with 100 µL of chloroform was set as 100% for each strain. (GJ) show lytic development of bacteriophage P1 in the wild type (green circles) and dksA (blue squares) hosts at 37 °C. The phage burst size was calculated as plaque forming units per infective center (pfu/IC). Bacteria were cultured after infection in LB containing 10 mM EGTA—panel (G). Cells were diluted in LB and the experiment was carried out for a longer period of time (H). Bacteria from overnight cultures were used for infection (I). (J) Effect of DksA overproduction. P1vir development in the wild type strain harboring pJK537 plasmid is represented by a yellow line and dksA mutant harboring pJK537 by a red line. Blue line indicates the wild type strain and green line determines the dksA mutant, not harboring plasmids. For all panels: blue squares or columns represent the wild type cells and green circles or columns represent the dksA mutant. Presented results are mean values obtained from at least three independent experiments. Error bars represent SD values. Statistical significance was estimated with t-test; asterisk (*) marks p < 0.05 and(ns) stands for not significant.
Figure 3
Figure 3
Regulation of P1vir and P1wt phage development. (A,B) Molecular regulation of the lytic pathway (P1wt and P1vir) and lysogeny maintenance (P1wt). In the lytic pathway, Coi, an anti-repressor, binds to C1, the primary repressor of lytic functions. The secondary anti-repressor Ant (Ant1-Ant2 dimer) binds to the C1 repressor lowering its level. At the same time, increasing concentrations of the Lxc protein expressed from the immT region lead to suppression of c1 gene expression. Next, genes in the immI region that are not blocked by the C4 antisense RNA, are expressed (compare panels (A) and (B))—the Icd protein suppresses cell division and Ant is a secondary anti-repressor. (C) Regulation of c1, the main lytic repressor gene, upon P1vir infection. l (D) Efficiency of P1wt lysogen formation in the wild type and dksA mutant strains. (E) Results of P1wt phage plaque morphology obtained for the wild type and dksA host strains. Photographs present general overview of plaques formed; graphs present plaque size (values are the mean area ± SD, whiskers show max and min, line across the boxes represents median), plaque size distribution, and relative plaque clarity (calculated as a reciprocal of integrated density values, which is the plaque median gray value divided by the plaque area). Asterisk (*) marks p < 0.05 and (ns) stands for not significant (F) Location of spontaneous mutations in the c4-ant1/2 region (illustrating how P1wt became P1vir) revealed by sequencing. Two substitutions in P1vir were found to be located in the P2c4 promoter region, near the antisense-C4-RNA binding site, and one in the PkilA promoter region.

Similar articles

Cited by

References

    1. Lehnherr H. Bacteriophage P1. In: Calendar R., editor. The Bacteriophages. Oxford University Press; Oxford, UK: 2006. pp. 350–379.
    1. Łobocka M.B., Rose D.J., Plunkett G., Rusin M., Samojedny A., Lehnherr H., Yarmolinsky M.B., Blattner F.R. Genome of Bacteriophage P1. J. Bacteriol. 2004;186:7032–7068. doi: 10.1128/JB.186.21.7032-7068.2004. - DOI - PMC - PubMed
    1. Lennox E.S. Transduction of linked genetic characters of the host by bacteriophage P1. Virology. 1955;1:190–206. doi: 10.1016/0042-6822(55)90016-7. - DOI - PubMed
    1. Yarmolinsky M.B. Bacteriophage P1 in retrospect and in prospect. J. Bacteriol. 2004;186:7025–7028. doi: 10.1128/JB.186.21.7025-7028.2004. - DOI - PMC - PubMed
    1. Yarmolinsky M.B., Sternberg N. Bacteriophage P1. In: Calendar R., editor. The Bacteriophages. The Viruses. Springer; Boston, MA, USA: 1988. pp. 291–438.

Substances

LinkOut - more resources