. 2021 May 31;13(6):1883.
doi: 10.3390/nu13061883.

Predicting Malnutrition Risk with Data from Routinely Measured Clinical Biochemical Diagnostic Tests in Free-Living Older Populations

Affiliations

Predicting Malnutrition Risk with Data from Routinely Measured Clinical Biochemical Diagnostic Tests in Free-Living Older Populations

Saskia P M Truijen et al. Nutrients. .

Abstract

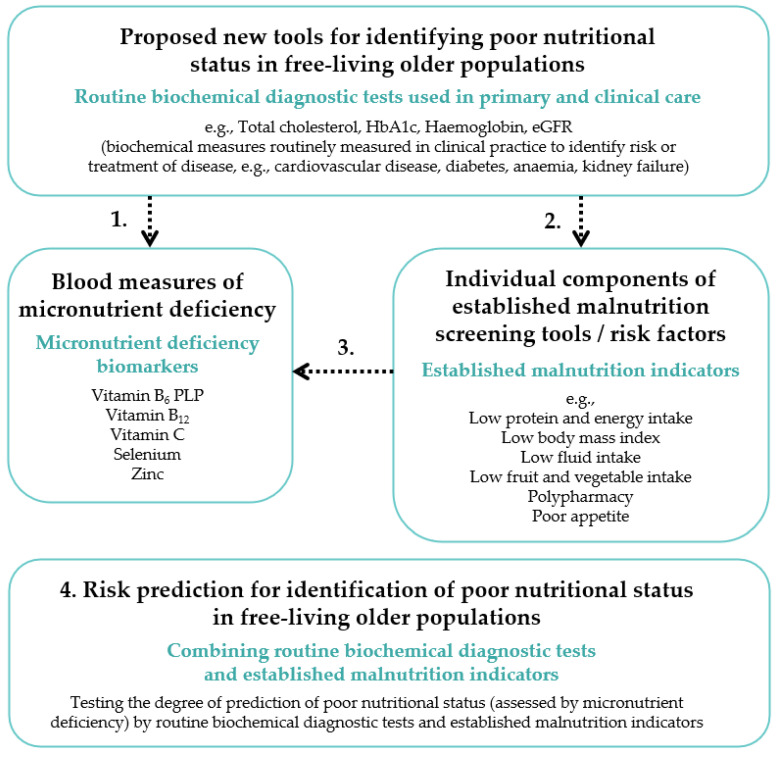
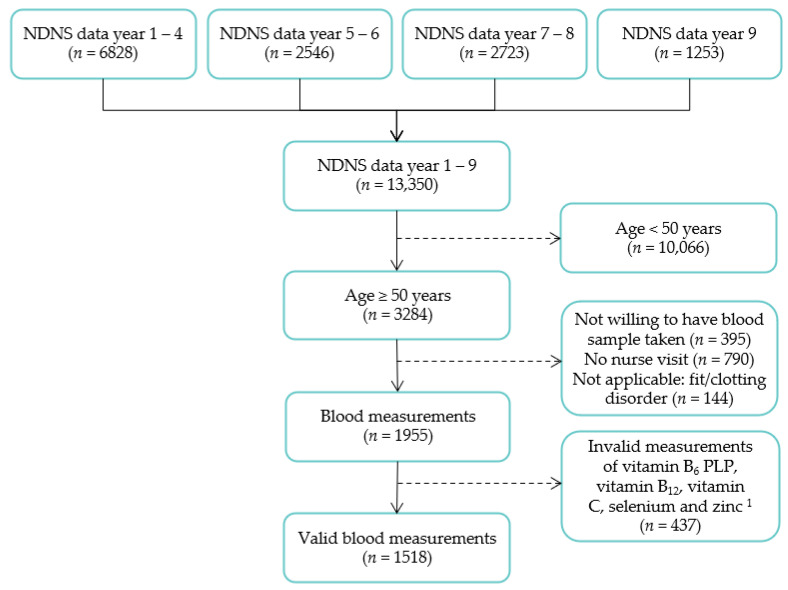
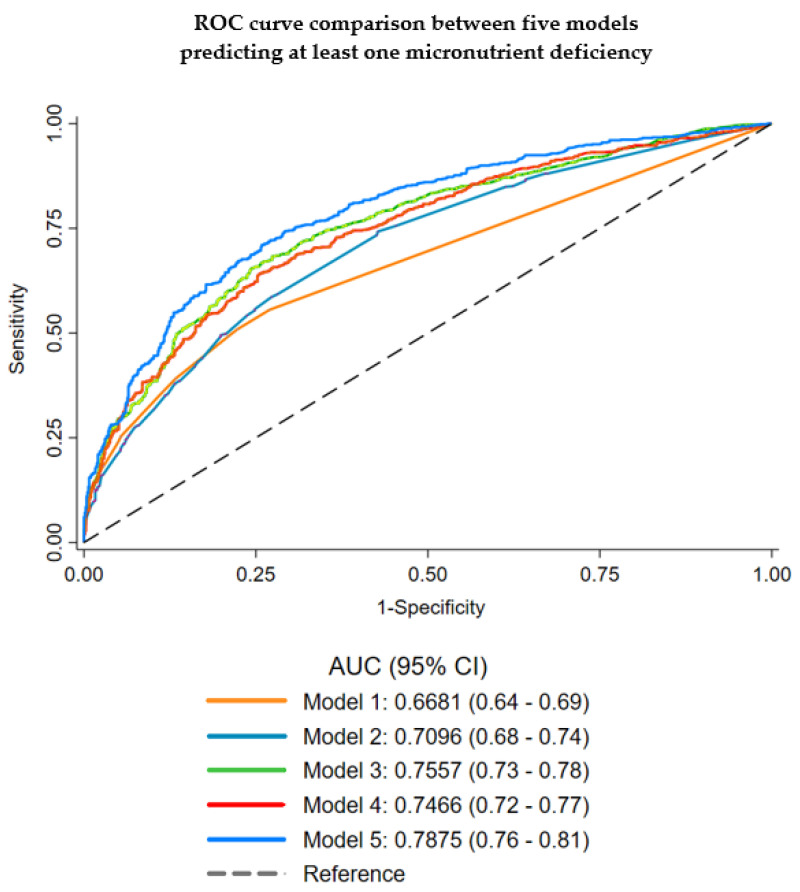
Malnutrition (undernutrition) in older adults is often not diagnosed before its adverse consequences have occurred, despite the existence of established screening tools. As a potential method of early detection, we examined whether readily available and routinely measured clinical biochemical diagnostic test data could predict poor nutritional status. We combined 2008-2017 data of 1518 free-living individuals ≥50 years from the United Kingdom National Diet and Nutrition Survey (NDNS) and used logistic regression to determine associations between routine biochemical diagnostic test data, micronutrient deficiency biomarkers, and established malnutrition indicators (components of screening tools) in a three-step validation process. A prediction model was created to determine how effectively routine biochemical diagnostic tests and established malnutrition indicators predicted poor nutritional status (defined by ≥1 micronutrient deficiency in blood of vitamins B6, B12 and C; selenium; or zinc). Significant predictors of poor nutritional status were low concentrations of total cholesterol, haemoglobin, HbA1c, ferritin and vitamin D status, and high concentrations of C-reactive protein; except for HbA1c, these were also associated with established malnutrition indicators. Additional validation was provided by the significant association of established malnutrition indicators (low protein, fruit/vegetable and fluid intake) with biochemically defined poor nutritional status. The prediction model (including biochemical tests, established malnutrition indicators and covariates) showed an AUC of 0.79 (95% CI: 0.76-0.81), sensitivity of 66.0% and specificity of 78.1%. Clinical routine biochemical diagnostic test data have the potential to facilitate early detection of malnutrition risk in free-living older populations. However, further validation in different settings and against established malnutrition screening tools is warranted.

Keywords: biochemical diagnostic tests; micronutrient deficiency biomarker; screening tool; undernutrition.


Conflict of interest statement

The authors declare no conflict of interest.

Figures

Figure 1
Figure 1
Schematic overview of the concepts used in the investigation of routinely measured diagnostic tests as potential predictors of poor nutritional status/malnutrition risk in free-living older populations. For analyses, a poor nutritional status was defined as the presence of ≥1 micronutrient deficiency. Stage 1: Micronutrient deficiency biomarkers used as validation for routine biochemical diagnostic tests used in primary and clinical care. Stage 2: Individual components of established malnutrition screening tools/risk factors (established malnutrition indicators) used as further validation for routine biochemical diagnostic tests. Stage 3: Micronutrient deficiency biomarkers used as validation for established malnutrition indicators. Stage 4: Routine biochemical diagnostic tests as potential predictors of poor nutritional status risk in free-living older populations.
Figure 2
Figure 2
Flowchart of the study population for analyses. 1 Reasons for invalid measurements included an incomplete blood volume, notional results, incorrect labelling and insufficient sample for analysis.
Figure 3
Figure 3
Area under the ROC curves (AUC) for five different predictive models of micronutrient deficiency showing discriminative ability (chi-square test p ≤ 0.001). Model 1: Routine biochemical diagnostic tests (total cholesterol, haemoglobin, ferritin, HbA1c, CRP and 25-hydroxy vitamin D). Model 2: Established malnutrition indicators (individual components of established malnutrition screening tools) (number of medicines, any dietary-supplement use in the last year, appetite, self-assessed general health, and fruit and vegetable intake). Model 3: Routine biochemical diagnostic tests + covariates (total cholesterol, haemoglobin, ferritin, HbA1c, CRP, 25-hydroxy vitamin D, sex, age category, ethnic group, region, qualification and smoking status). Model 4: Established malnutrition indicators + covariates (number of medicines, any dietary-supplement use in the last year, appetite, self-assessed general health, fruit and vegetable intake, sex, age category, ethnic group, region, qualification and smoking status). Model 5: Routine biochemical diagnostic tests + established malnutrition indicators + covariates (final prediction model) (total cholesterol, haemoglobin, ferritin, HbA1c, CRP, 25-hydroxy vitamin D, number of medicines, any dietary-supplement use in the last year, appetite, self-assessed general health, fruit and vegetable intake, sex, age category, ethnic group, region, qualification and smoking status).

Similar articles

Cited by

References

    1. Tournadre A., Vial G., Capel F., Soubrier M., Boirie Y. Sarcopenia. Jt. Bone Spine. 2019;86:309–314. doi: 10.1016/j.jbspin.2018.08.001. - DOI - PubMed
    1. Cruz-Jentoft A.J., Sayer A.A. Sarcopenia. Lancet. 2019;393:2636–2646. doi: 10.1016/S0140-6736(19)31138-9. - DOI - PubMed
    1. Lanham-New S.A., Webb A.R., Cashman K.D., Buttriss J.L., Fallowfield J.L., Masud T., Hewison M., Mathers J.C., Kiely M., Welch A.A., et al. Vitamin D and SARS-CoV-2 virus/COVID-19 disease. BMJ Nutr. Prev. Health. 2020;31:106. doi: 10.1136/bmjnph-2020-000089. - DOI - PMC - PubMed
    1. Hong X., Yan J., Xu L., Shen S., Zeng X., Chen L. Relationship between nutritional status and frailty in hospitalized older patients. Clin. Interv. Aging. 2019;14:105–111. doi: 10.2147/CIA.S189040. - DOI - PMC - PubMed
    1. Lorenzo-López L., Maseda A., De Labra C., Regueiro-Folgueira L., Rodríguez-Villamil J.L., Millán-Calenti J.C. Nutritional determinants of frailty in older adults: A systematic review. BMC Geriatr. 2017;17:1–13. doi: 10.1186/s12877-017-0496-2. - DOI - PMC - PubMed