. 2021 May 31;13(6):1035.
doi: 10.3390/v13061035.

Bovine Parainfluenza Virus Type 3 (BPIV3) Enters HeLa Cells via Clathrin-Mediated Endocytosis in a Cholesterol- and Dynamin-Dependent Manner

Affiliations

Bovine Parainfluenza Virus Type 3 (BPIV3) Enters HeLa Cells via Clathrin-Mediated Endocytosis in a Cholesterol- and Dynamin-Dependent Manner

Wei Pan et al. Viruses. .

Abstract

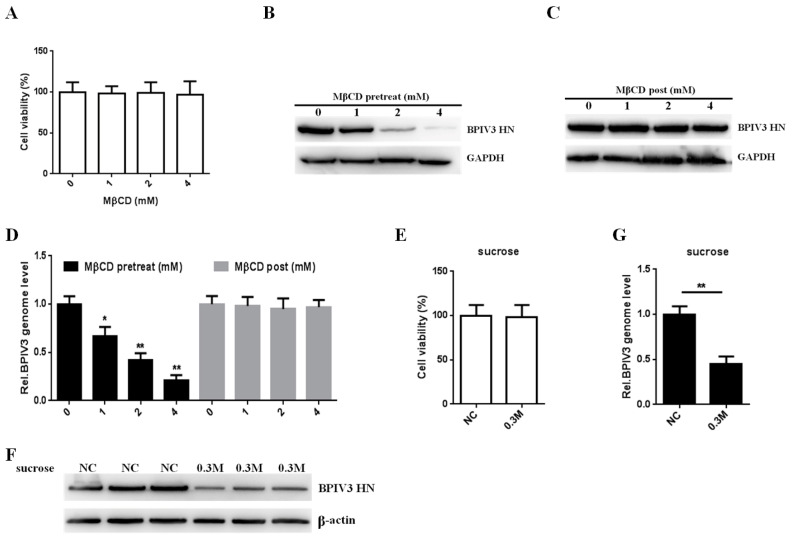
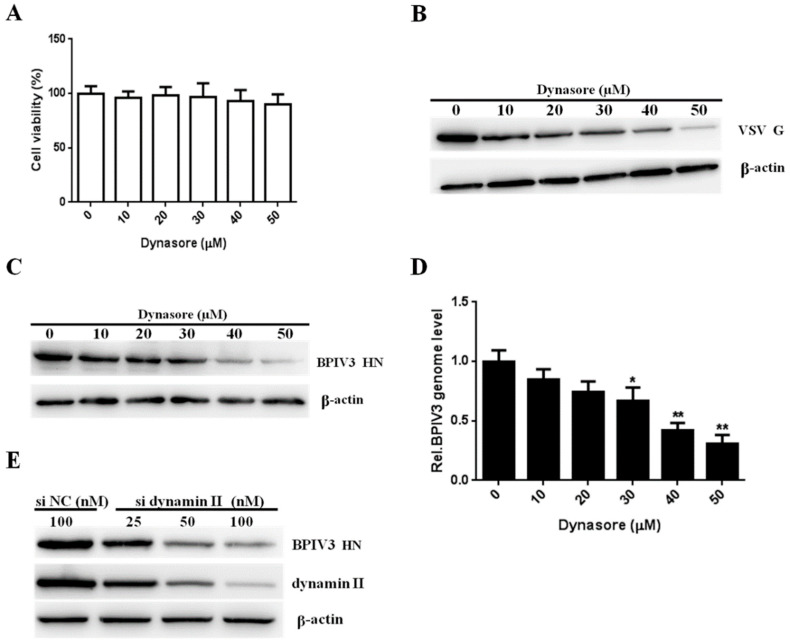
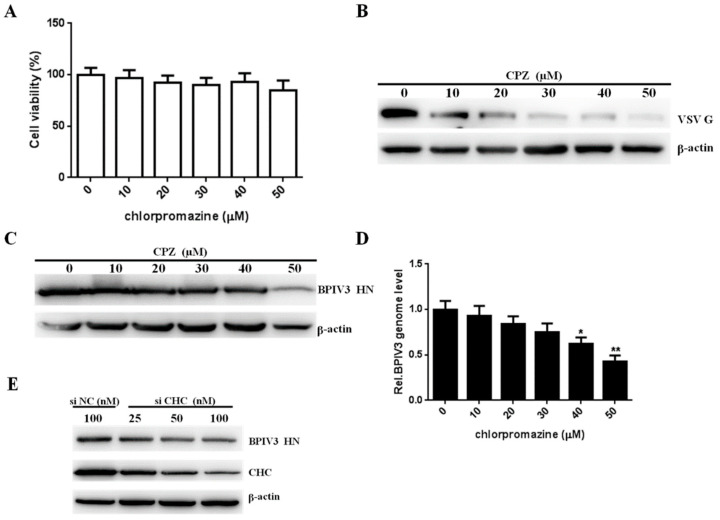
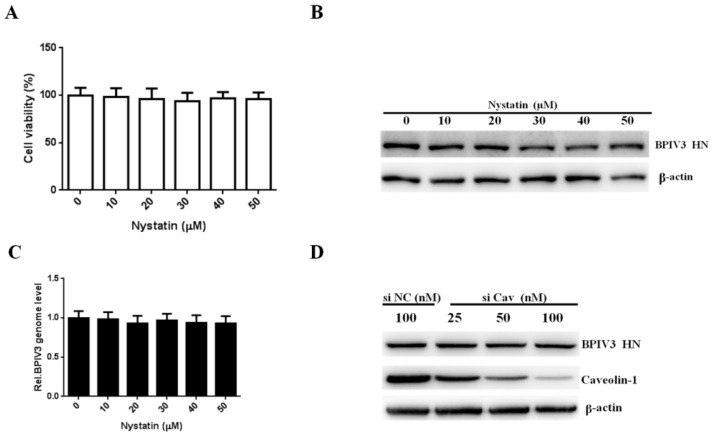
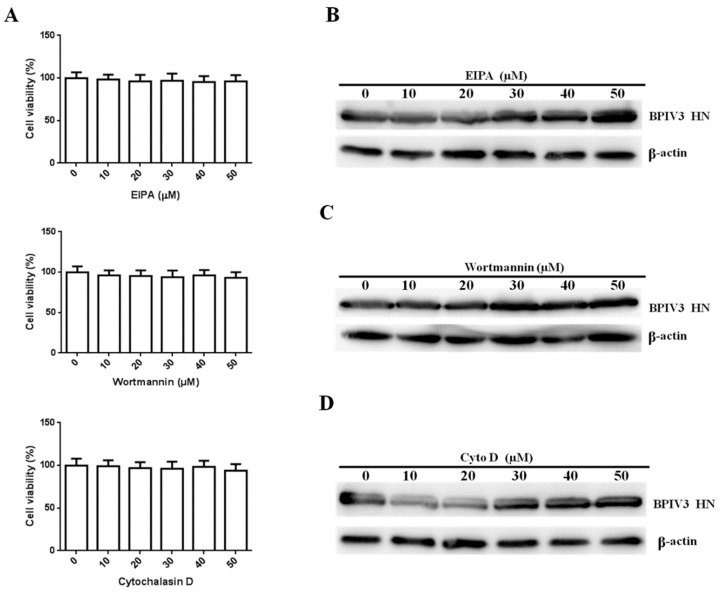
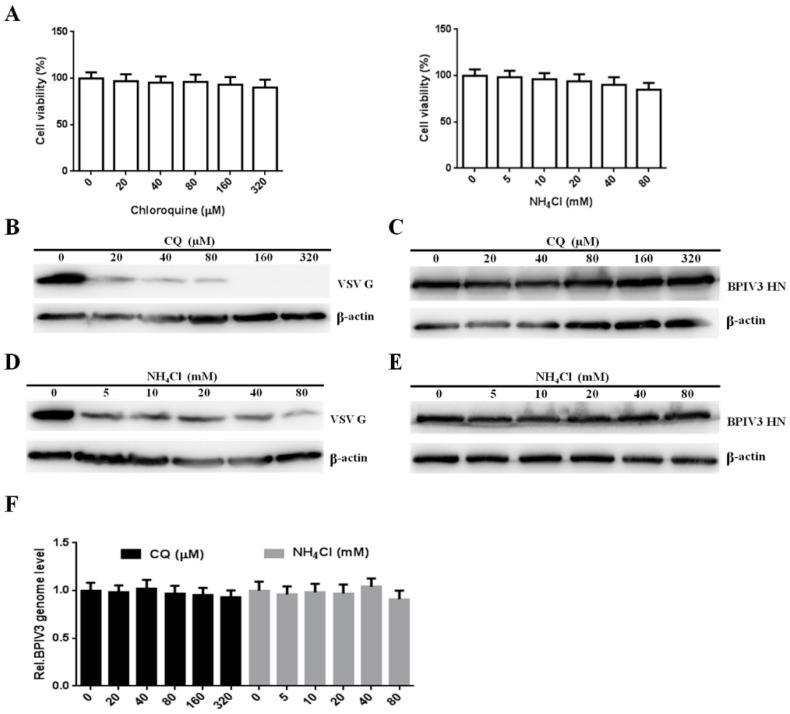
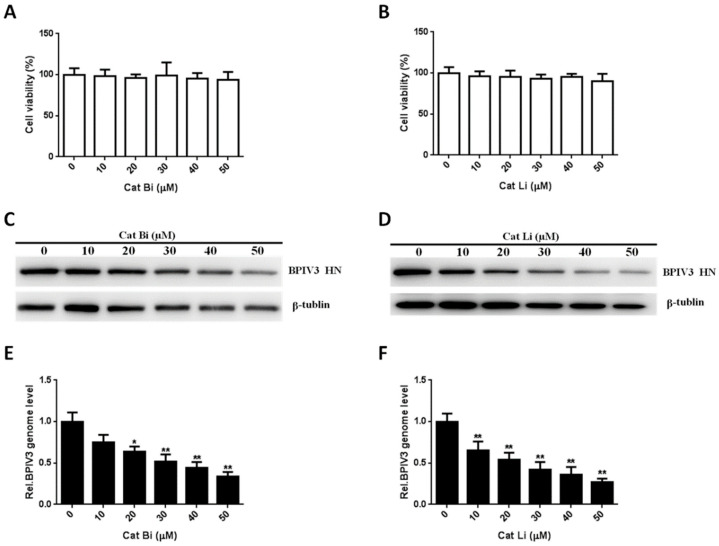
Bovine parainfluenza virus 3 (BPIV3) is a crucial causative agent of respiratory disease in young and adult cattle. No specific therapies are available for BPIV3 infection. Understanding the internalization pathway of the virus will provide a new strategy for the development of antiviral therapy. Here, the mechanism of BPIV3 entry into HeLa cells was analyzed using RNA silencing and pharmacological inhibitors. Treatment of HeLa cells with hypertonic medium prevented BPIV3 internalization. These results indicated that BPIV3 entered HeLa cells via receptor-mediated endocytosis. Moreover, removing cell membrane cholesterol through MβCD treatment hampered viral penetration but not viral replication. In addition, BPIV3 infection was inhibited by pretreatment with dynasore or chlorpromazine (CPZ) or knockdown of dynamin II or clathrin heavy chain. However, virus entry was unaffected by nystatin, EIPA, wortmannin, or cytochalasin D treatment or caveolin-1 knockdown. These data demonstrated that the entry of BPIV3 into HeLa cells was dependent on clathrin-mediated endocytosis but not on caveolae-mediated endocytosis or the macropinocytosis pathway. Many viruses are transported to endosomes, which provide an acidic environment and release their genome upon separation from primary endocytic vesicles. However, we found that BPIV3 infection required endosomal cathepsins, but not a low pH. In summary, we show, for the first time, that BPIV3 enters HeLa cells through the clathrin-mediated endocytosis pathway, presenting novel insights into the invasion mechanism of Paramyxoviridae.

Keywords: BPIV3; cathepsins; clathrin; endocytosis; virus entry.


Conflict of interest statement

The authors declare no conflict of interest.

Figures

Figure 1
Figure 1
Effect of MβCD and hypertonic medium on BPIV3 infection. (A) The cytotoxicity of MβCD was determined by CCK-8 assays (0 vs. 1, p = 0.5743; 0 vs. 2, p = 0.6724; 0 vs. 4, p = 0.7215). (B) MβCD inhibited penetration of BPIV3. HeLa cells were preincubated with MβCD and infected with BPIV3 (MOI = 1). After the infected cells were incubated for 5 h, levels of BPIV3 HN were were determined by western blot. GAPDH served as the loading control. (C) MβCD had no effect on BPIV3 replication. HeLa cells preinoculated with BPIV3 (MOI = 1) for 1 h were treated with MβCD for 1 h. After the infected cells were incubated for 5 h, levels of BPIV3 HN were determined by western blot. GAPDH served as the loading control. (D) HeLa cells were pretreated or post-treated with MβCD and inoculated with BPIV3 (MOI = 1). After the infected cells were incubated for 2 h, the viral genome level was detected by RT-qPCR (for MβCD pretreated groups: 0 vs. 1, p = 0.014; 0 vs. 2, p = 0.0008; 0 vs. 4, p = 0.0002; for MβCD post-treated groups: 0 vs. 1, p = 0.7994; 0 vs. 2, p = 0.5654; 0 vs. 4, p = 0.6649). (E) The cytotoxicity of 0.3 M sucrose was determined by CCK-8 assays (p = 0.8601). (F) Hypertonic medium suppressed BPIV3 infection. HeLa cells were preincubated with medium containing either 0.3 M sucrose (hypertonic medium) or normal culture medium (NC) and infected with BPIV3 (MOI = 1). After the infected cells were incubated for 5 h, levels of BPIV3 HN were determined by western blot. β-actin served as the loading control. (G) Hypertonic medium inhibited BPIV3 entry. HeLa cells were pretreated with 0.3 M sucrose at the indicated concentrations and inoculated with BPIV3 (MOI = 1). After the infected cells were incubated for 2 h, the viral genome level was detected by RT-qPCR (p = 0.0015). The data are based on three independent experiments with at least three replicates for each. The data are shown as the means ± SD (** p < 0.01; * p < 0.05;).
Figure 2
Figure 2
BPIV3 entry depends on dynamin. (A) The cytotoxicity of dynasore was determined by CCK-8 assays (0 vs. 10, p = 0.4780; 0 vs. 20, p = 0.7549; 0 vs. 30, p = 0.7295; 0 vs. 40, p = 0.3767; 0 vs. 50, p = 0.2053). (B,C) Dynasore inhibited VSV and BPIV3 infection. HeLa cells were pretreated with dynasore at the indicated concentrations and inoculated with VSV (MOI = 1) or BPIV3 (MOI = 1). After the infected cells were incubated for 4 h (for VSV) or 5 h (for BPIV3), levels of VSV G and BPIV3 HN were determined by western blot. β-actin served as the loading control. (D) HeLa cells were pretreated with dynasore at the indicated concentrations and inoculated with BPIV3 (MOI = 1) and incubated for 2 h. The viral genome level was determined by RT-qPCR (0 vs. 10, p = 0.4072; 0 vs. 20, p = 0.0823; 0 vs. 30, p = 0.0423; 0 vs. 40, p = 0.0076; 0 vs. 50, p = 0.0021). (E) HeLa cells transfected with the siRNA negative control (siNC) or increasing amounts of siRNA targeting dynamin II (si dynamin II) were inoculated with BPIV3 (MOI = 1) and incubated for 5 h, then the BPIV3 HN and dynamin II protein levels were determined by western blot. β-actin served as the loading control. The data are based on three independent experiments with at least three replicates for each. The data are displayed as the means ± SD (** p < 0.01; * p < 0.05;).
Figure 3
Figure 3
Clathrin is required for BPIV3 entry. (A) The cytotoxicity of CPZ was determined by CCK-8 assays (0 vs. 10, p = 0.6302; 0 vs. 20, p = 0.2345; 0 vs. 30, p = 0.1461; 0 vs. 40, p = 0.3222; 0 vs. 50, p = 0.0860). (B,C) CPZ inhibited VSV and BPIV3 infection. HeLa cells were preincubated with CPZ at the indicated concentrations and inoculated with VSV (MOI = 1) or BPIV3 (MOI = 1). After the infected cells were incubated for 4 h (for VSV) or 5 h (for BPIV3), levels of VSV G and BPIV3 HN were determined by western blot. β-actin served as the loading control. (D) HeLa cells preincubated with CPZ were infected with BPIV3 (MOI = 1) and incubated for 2 h, and the viral genome level was determined by RT-qPCR (0 vs. 10, p = 0.4473; 0 vs. 20, p = 0.0915; 0 vs. 30, p = 0.0612; 0 vs. 40, p = 0.0231; 0 vs. 50, p = 0.0072). (E) HeLa cells transfected with nontargeting control RNA (siNC) or increasing amounts of siRNA targeting CHC (siCHC) were infected with BPIV3 (MOI = 1) and incubated for 5 h, and the viral HN and CHC protein levels were determined by western blot analysis. β-actin served as the loading control. The data are based on three independent experiments with at least three replicates for each. The data are displayed as the means ± SD (** p < 0.01; * p < 0.05;).
Figure 4
Figure 4
Caveolin is not required for BPIV3 entry. (A) The cytotoxicity of nystatin was determined by CCK-8 assays. (0 vs. 10, p = 0.7913; 0 vs. 20, p = 0.6386; 0 vs. 30, p = 0.4248; 0 vs. 40, p = 0.6319; 0 vs. 50, p = 0.5440). (B) HeLa cells were pretreated with nystatin and inoculated with BPIV3 (MOI = 1). After the infected cells were incubated for 5 h, levels of BPIV3 HN were determined by western blot. β-actin served as the loading control. (C) HeLa cells were pretreated with nystatin at the indicated concentrations and inoculated with BPIV3 (MOI = 1) for 2 h, and the viral genome level was determined by RT-qPCR (0 vs. 10, p = 0.7980; 0 vs. 20, p = 0.4020; 0 vs. 30, p = 0.6862; 0 vs. 40, p = 0.4580; 0 vs. 50, p = 0.3902). (D) HeLa cells transfected with siRNA negative control (siNC) or increasing amounts of siRNA targeting caveolin-1 (siCav) were infected with BPIV3 (MOI = 1) and incubated for 5 h, and viral HN and caveolin-1 protein levels were detected by western blot analysis. The data are based on three independent experiments with at least three replicates for each. The data are displayed as the means± SD.
Figure 5
Figure 5
BPIV3 entry does not depend on macropinocytosis (for EIPA: 0 vs. 10, p = 0.7201; 0 vs. 20, p = 0.5405; 0 vs. 30, p = 0.6511; 0 vs. 40, p = 0.4288; 0 vs. 50, p = 0.5257; for wortmannin: 0 vs. 10, p = 0.5059; 0 vs. 20, p = 0.4400; 0 vs. 30, p = 0.3893; 0 vs. 40, p = 0.5171; 0 vs. 50, p = 0.2938; for cytochalasin D: 0 vs. 10, p = 0.8760; 0 vs. 20, p = 0.6423; 0 vs. 30, p = 0.5754; 0 vs. 40, p = 0.7631; 0 vs. 50, p = 0.3934). (A) Cell viability upon EIPA, wortmannin, and cytochalasin D treatment was evaluated. HeLa cells seeded in 96-well plates were treated with EIPA, cytochalasin D for 7 h, or wortmannin for 3 h at the indicated concentrations, then cell viability was determined as described in the text. (BD) HeLa cells were pretreated with EIPA, wortmannin, or cytochalasin D at the indicated concentrations and inoculated with BPIV3 (MOI = 1). After the infected cells were incubated for 5 h, levels of BPIV3 HN were determined by western blot. β-actin served as the loading control. The data are based on three independent experiments with at least three replicates for each. The data are displayed as the means ± SD.
Figure 6
Figure 6
The entry of BPIV3 into HeLa cells is pH-independent. (A) Cell viability upon CQ or NH4Cl treatment was determined (for CQ: 0 vs. 20, p = 0.6227; 0 vs. 40, p = 0.4091; 0 vs. 80, p = 0.5350; 0 vs. 160, p = 0.3147; 0 vs. 320, p = 0.1833; for NH4Cl: 0 vs. 5, p = 0.7403; 0 vs. 10, p = 0.5028; 0 vs. 20, p = 0.3572; 0 vs. 40, p = 0.1802; 0 vs. 80, p = 0.0554). (B,D) HeLa cells preincubated with CQ or NH4Cl were infected with VSV (MOI = 1). After the infected cells were incubated for 4 h, levels of VSV G were determined by western blot. β-actin served as the loading control. (C,E) HeLa cells were pretreated with CQ or NH4Cl at the indicated concentrations and inoculated with BPIV3 (MOI = 1). After the infected cells were incubated for 5 h, levels of BPIV3 HN were determined by western blot. β-actin served as the loading control. (F) HeLa cells preincubated with CQ or NH4Cl were infected with BPIV3 (MOI = 1). The viral genome level was detected by RT-qPCR 2 h postinfection (for CQ: 0 vs. 20, p = 0.7710; 0 vs. 40, p = 0.7937; 0 vs. 80, p = 0.6773; 0 vs. 160, p = 0.4894; 0 vs. 320, p = 0.3318; for NH4Cl: 0 vs. 5, p = 0.6098; 0 vs. 10, p = 0.8042; 0 vs. 20, p = 0.7144; 0 vs. 40, p = 0.6153; 0 vs. 80, p = 0.2970). The data are based on three independent experiments with at least three replicates for each. The data are displayed as the means ± SD.
Figure 7
Figure 7
The entry of BPIV3 into HeLa cells requires cathepsin activity. (A,B) Cell viability upon Cat Bi or Cat Li treatment was determined, as described in the text (for Cat Bi: 0 vs. 10, p = 0.7748; 0 vs. 20, p = 0.4801; 0 vs. 30, p = 0.9271; 0 vs. 40, p = 0.4551; 0 vs. 50, p = 0.4402; for Cat Li: 0 vs. 10, p = 0.4942; 0 vs. 20, p = 0.4610; 0 vs. 30, p = 0.2315; 0 vs. 40, p = 0.3432; 0 vs. 50, p = 0.2034). (C,D) HeLa cells were pretreated with Cat Bi or Cat Li at the indicated concentrations and inoculated with BPIV3 (MOI = 1). After the infected cells were incubated for 5 h, levels of BPIV3 HN were determined by western blot. β-tublin served as the loading control. (E,F) HeLa cells were pretreated with Cat Bi or Cat Li at the indicated concentrations and inoculated with BPIV3 (MOI = 1). The infected cells were incubated for 2 h, and the viral genome level was detected by RT-qPCR (for Cat Bi: 0 vs. 10, p = 0.0782; 0 vs. 20, p = 0.0276; 0 vs. 30, p = 0.0039; 0 vs. 40, p = 0.0018; 0 vs. 50, p = 0.0007; for Cat Li: 0 vs. 10, p = 0.0087; 0 vs. 20, p = 0.0035; 0 vs. 30, p = 0.0017; 0 vs. 40, p = 0.0012; 0 vs. 50, p = 0.0003). The data are based on three independent experiments with at least three replicates for each. The data are displayed as the means ± SD (** p < 0.01; * p < 0.05).
Figure 8
Figure 8
Entry of BPIV3 into HeLa cells requires cathepsin activity. (A,B) Cell viability upon Cat Bi or Cat Li treatment was determined, as described in the text. (C,D) HeLa cells were pretreated with Cat Bi or Cat Li at the indicated concentrations and inoculated with BPIV3 (MOI = 1). After the infected cells were incubated for 5 h, they were harvested and subjected to western blot analysis. (E,F) HeLa cells were pretreated with Cat Bi or Cat Li at the indicated concentrations and inoculated with BPIV3 (MOI = 1). The infected cells were incubated for 2 h, and the viral genome level was detected by RT-qPCR. The data are based on 3 independent experiments with at least three replicates for each. The data are displayed as the means± SD (** p < 0.01; * p < 0.05).

Similar articles

Cited by

References

    1. Leal É., Liu C., Zhao Z., Deng Y., Villanova F., Liang L., Li J., Cui S. Isolation of a Divergent Strain of Bovine Parainfluenza Virus Type 3 (BPIV3) Infecting Cattle in China. Viruses. 2019;11:489. doi: 10.3390/v11060489. - DOI - PMC - PubMed
    1. Ellis J.A. Bovine Parainfluenza-3 Virus. Vet. Clin. North Am. Food Anim. Prac. 2010;26:575–593. doi: 10.1016/j.cvfa.2010.08.002. - DOI - PubMed
    1. Mercer J., Schelhaas M., Helenius A. Virus Entry by Endocytosis. Annu. Rev. Biochem. 2010;79:803–833. doi: 10.1146/annurev-biochem-060208-104626. - DOI - PubMed
    1. Cheng C.Y., Shih W.L., Huang W.R., Chi P.I., Wu M.H., Liu H.J. Bovine ephemeral fever virus uses a clathrin-mediated and dynamin 2-dependent endocytosis pathway that requires Rab5 and Rab7 as well as microtubules. J. Virol. 2012;86:13653–13661. doi: 10.1128/JVI.01073-12. - DOI - PMC - PubMed
    1. Hernaez B., Alonso C. Dynamin- and clathrin-dependent endocytosis in African swine fever virus entry. J. Virol. 2010;84:2100–2109. doi: 10.1128/JVI.01557-09. - DOI - PMC - PubMed

Publication types