. 2021 May 31;22(11):5914.
doi: 10.3390/ijms22115914.

Inferring Single-Cell 3D Chromosomal Structures Based on the Lennard-Jones Potential

Affiliations

Inferring Single-Cell 3D Chromosomal Structures Based on the Lennard-Jones Potential

Mengsheng Zha et al. Int J Mol Sci. .

Abstract

Reconstructing three-dimensional (3D) chromosomal structures based on single-cell Hi-C data is a challenging scientific problem due to the extreme sparseness of the single-cell Hi-C data. In this research, we used the Lennard-Jones potential to reconstruct both 500 kb and high-resolution 50 kb chromosomal structures based on single-cell Hi-C data. A chromosome was represented by a string of 500 kb or 50 kb DNA beads and put into a 3D cubic lattice for simulations. A 2D Gaussian function was used to impute the sparse single-cell Hi-C contact matrices. We designed a novel loss function based on the Lennard-Jones potential, in which the ε value, i.e., the well depth, was used to indicate how stable the binding of every pair of beads is. For the bead pairs that have single-cell Hi-C contacts and their neighboring bead pairs, the loss function assigns them stronger binding stability. The Metropolis-Hastings algorithm was used to try different locations for the DNA beads, and simulated annealing was used to optimize the loss function. We proved the correctness and validness of the reconstructed 3D structures by evaluating the models according to multiple criteria and comparing the models with 3D-FISH data.

Keywords: 3D chromosomal structure; 3D genome; Lennard-Jones potential; single-cell Hi-C.


Conflict of interest statement

The authors declare no conflict of interest.

Figures
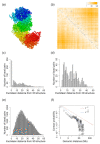
Figure 1
Figure 1
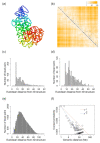
(a) The inferred 3D structure of the X-chromosome of a mouse Th1 cell at 50 kb resolution when n in Equation (3) equals 2. (b) Each black dot indicates one single-cell Hi-C contact. The darker orange color indicates higher Euclidean distances parsed from the inferred 3D structure, and the white color indicates small Euclidean distances parsed from the inferred 3D structure. (c) The distribution of the number of bead pairs over different values of Euclidean distances parsed from the inferred structure when θi,j=1. (d) The distribution of the number of bead pairs over different values of Euclidean distances parsed from the inferred structure when θi,j0.7, 1. (e) The distribution of the number of bead pairs over different values of Euclidean distances parsed from the inferred structure when θi,j0, 0.7. (f) The contact probability of bead pairs over different values of genomic distances.
Figure 2
Figure 2
(ad) are the 3D structures of the X-chromosome of a TH1 cell when rm in Equation (3) equals 8.976 and n in Equation (3) equals 1, 2, 3, and 4, respectively. (eh) are the 3D structures of the X-chromosome of a TH1 cell when rm in Equation (3) equals 8 and n in Equation (3) equals 1, 2, 3, and 4, respectively.
Figure 3
Figure 3
(ac) The 3D structure of the X-chromosome of a TH1 cell that is inferred by our Lennard-Jones method and its evaluations. (df) The 3D structure of the X-chromosome of a TH1 cell that is inferred by SCL and its evaluations. (gi) The 3D structure of the X-chromosome of a TH1 cell inferred by nuc_dynamics and its evaluations. (a,d,g) are the 3D structures inferred by our Lennard-Jones method, SCL, and nuc_dynamics. (b,e,h) Each black dot indicates one single-cell Hi-C contact. The darker orange color indicates higher Euclidean distances parsed from the inferred 3D structure, and the white color indicates small Euclidean distances parsed from the inferred 3D structure. (c,f,i) The contact probability of bead pairs over different values of genomic distances.
Figure 4
Figure 4
(ac) Distributions of the number of nodes for the 3D structure inferred by our Lennard-Jones method. (df) Distributions of the number of nodes for the 3D structure inferred by SCL. (gi) Distributions of the number of nodes for the 3D structure inferred by nuc_dynamics. (a,d,g) The distribution of the number of bead pairs over different values of Euclidean distances parsed from the inferred structure when θi,j=1. (b,e,h) The distribution of the number of bead pairs over different values of Euclidean distances parsed from the inferred structure when θi,j0.7, 1. (c,f,i) The distribution of the number of bead pairs over different values of Euclidean distances parsed from the inferred structure when θi,j0, 0.7.
Figure 5
Figure 5
(a,i) The 500 kb resolution 3D structures of the inactive and active X-chromosome of a GM12878 cell, which is inferred by our Lennard-Jones method, respectively. (e,m) The 500 kb resolution 3D structures of the inactive and active X-chromosome of a GM12878 cell, which is inferred by SCL, respectively. (b,f,j,n) are the 50 kb resolution structures corresponding to (a,e,i,m). (c,d) are the evaluations for (a). (g,h) are the evaluations for (e). (k,l) are the evaluations for (i). (o) and (p) are the evaluations for (m).
Figure 6
Figure 6
(a) The inferred 3D structure of the chromosome 3 of a mouse oocyte cell at 500 kb resolution. (b) Each black dot indicates one single-cell Hi-C contact. The darker orange color indicates higher Euclidean distances parsed from the inferred 3D structure, and the white color indicates small Euclidean distances parsed from the inferred 3D structure. (c) The distribution of the number of bead pairs over different values of Euclidean distances parsed from the inferred structure when θi,j=1. (d) The distribution of the number of bead pairs over different values of Euclidean distances parsed from the inferred structure when θi,j0.7, 1. (e) The distribution of the number of bead pairs over different values of Euclidean distances parsed from the inferred structure when θi,j0, 0.7. (f) The contact probability of bead pairs over different values of genomic distances.
Figure 7
Figure 7
A diagram showing the negative, positive, and zero energy.
Figure 8
Figure 8
(a) The balls are not interacting as they have an infinite distance. (b) Two balls are brought closer with minimum energy to a distance of r. The two balls have an attractive force between them. (c) The two balls are brought closer by the attractive force between them until they reach an equilibrium distance, at which they reach the sminimum bonding potential. (d) External energy pushes the two balls even closer. A repulsive force tries to push the two balls apart, and the repulsive force is greater than the attractive force.
Figure 9
Figure 9
A diagram showing the curve of the Lennard-Jones potential.

References

    1. Bickmore W.A., van Steensel B. Genome architecture: Domain organization of interphase chromosomes. Cell. 2013;152:1270–1284. doi: 10.1016/j.cell.2013.02.001. - DOI - PubMed
    1. Sexton T., Cavalli G. The role of chromosome domains in shaping the functional genome. Cell. 2015;160:1049–1059. doi: 10.1016/j.cell.2015.02.040. - DOI - PubMed
    1. Pombo A., Dillon N. Three-dimensional genome architecture: Players and mechanisms. Nat. Rev. Mol. Cell Biol. 2015;16:245–257. doi: 10.1038/nrm3965. - DOI - PubMed
    1. Therizols P., Illingworth R.S., Courilleau C., Boyle S., Wood A.J., Bickmore W.A. Chromatin decondensation is sufficient to alter nuclear organization in embryonic stem cells. Science. 2014;346:1238–1242. doi: 10.1126/science.1259587. - DOI - PMC - PubMed
    1. Gonzalez-Sandoval A., Towbin B.D., Kalck V., Cabianca D.S., Gaidatzis D., Hauer M.H., Geng L., Wang L., Yang T., Wang X. Perinuclear anchoring of H3K9-methylated chromatin stabilizes induced cell fate in C. elegans embryos. Cell. 2015;163:1333–1347. doi: 10.1016/j.cell.2015.10.066. - DOI - PubMed

LinkOut - more resources