

Supervised Machine Learning Methods and Hyperspectral Imaging Techniques Jointly Applied for Brain Cancer Classification
- PMID: 34073145
- PMCID: PMC8199064
- DOI: 10.3390/s21113827
Supervised Machine Learning Methods and Hyperspectral Imaging Techniques Jointly Applied for Brain Cancer Classification
Abstract
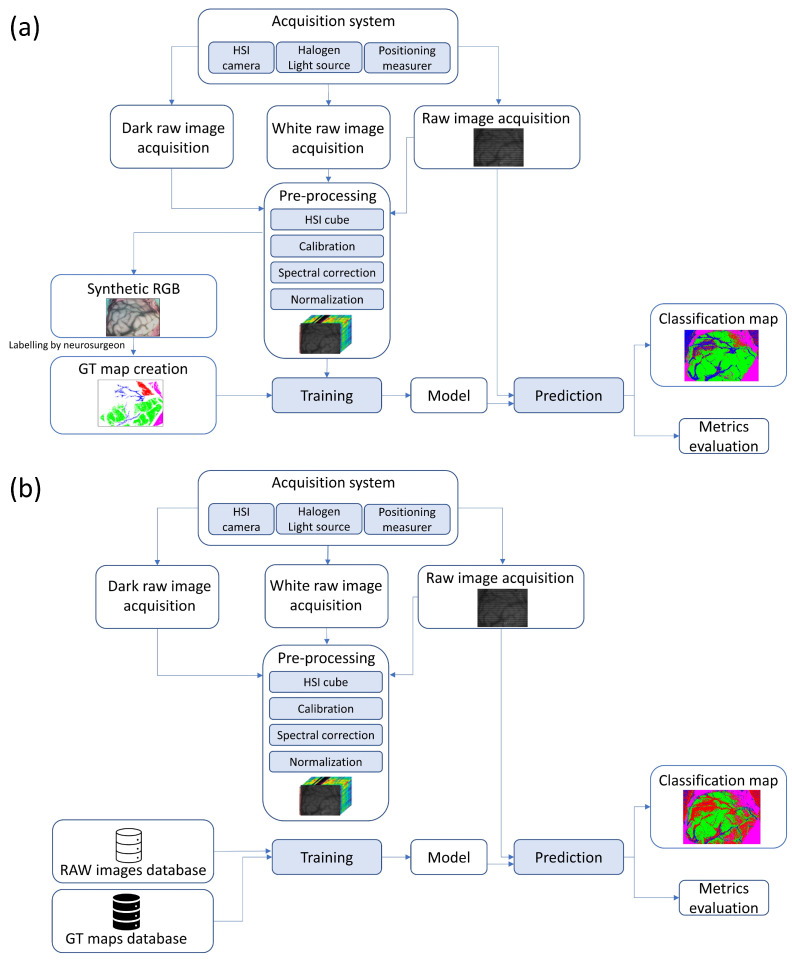
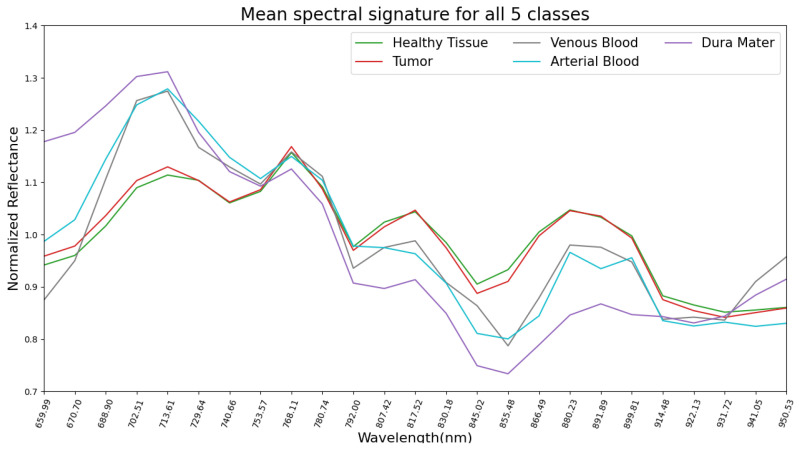
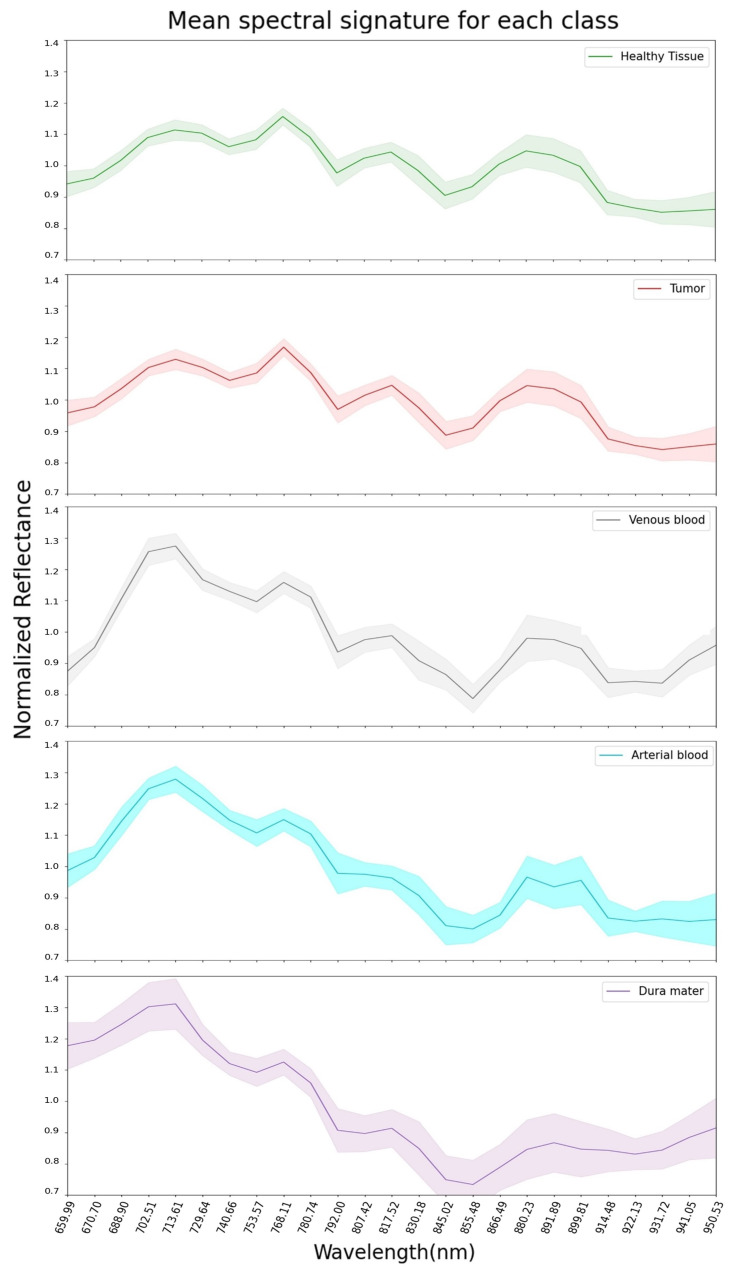
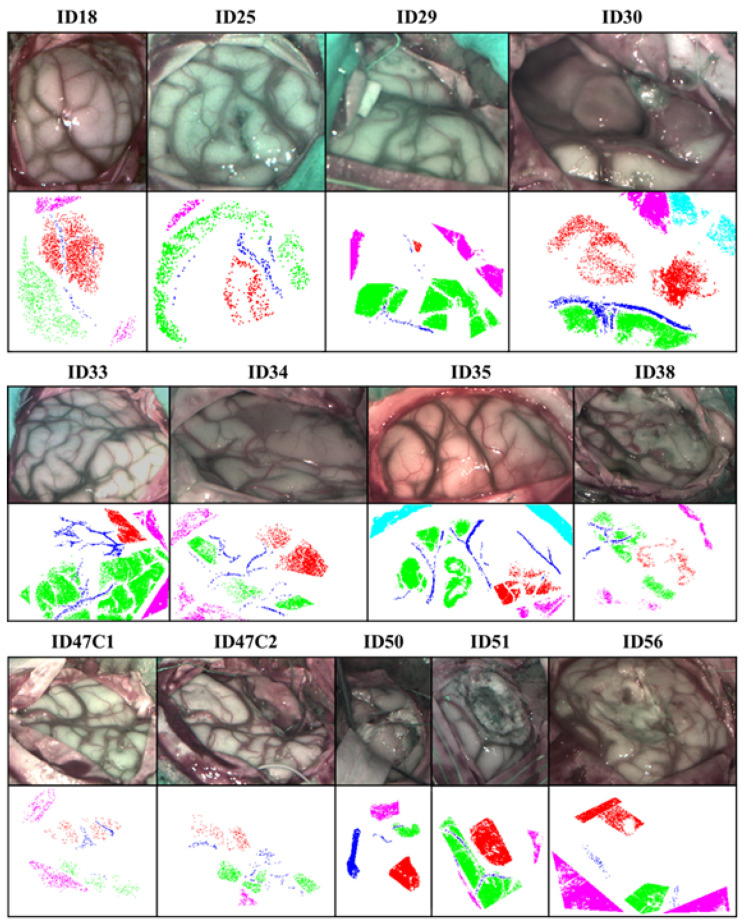
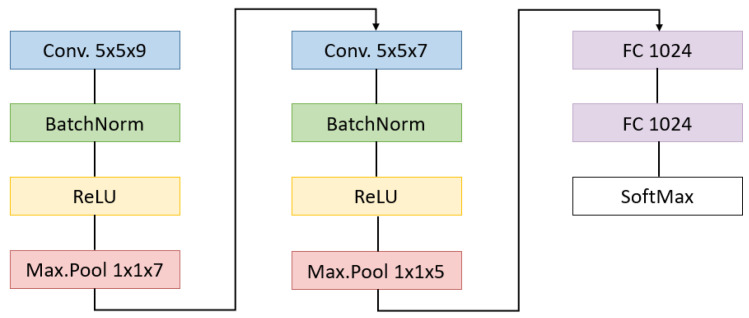
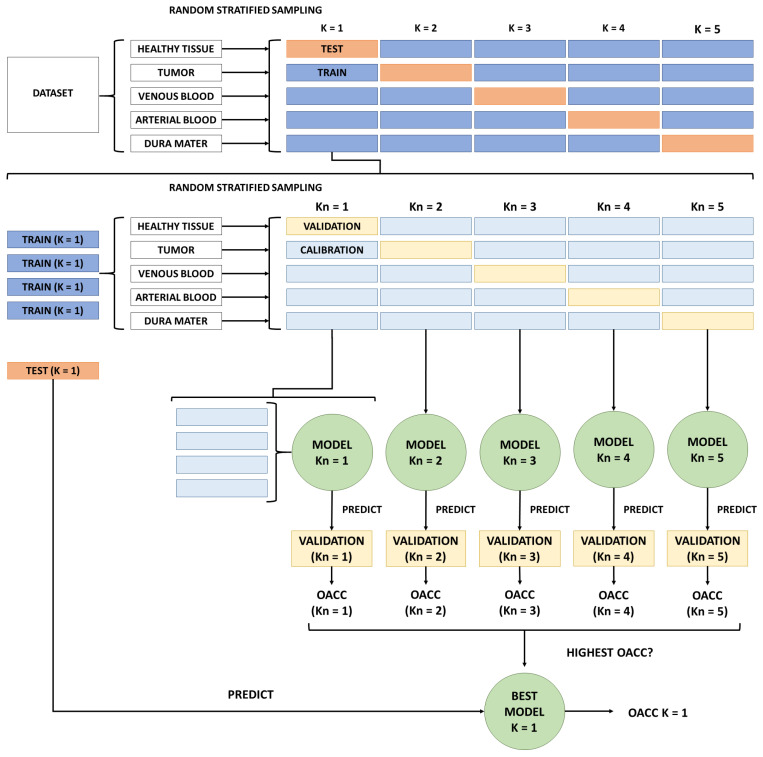
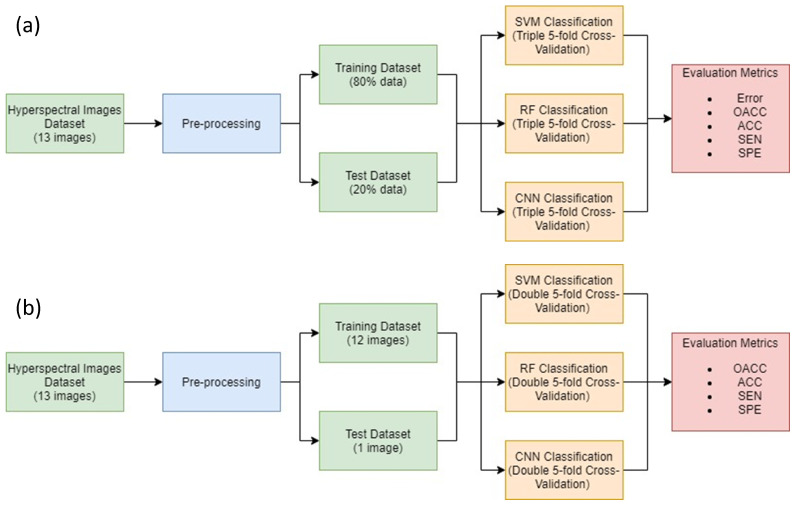
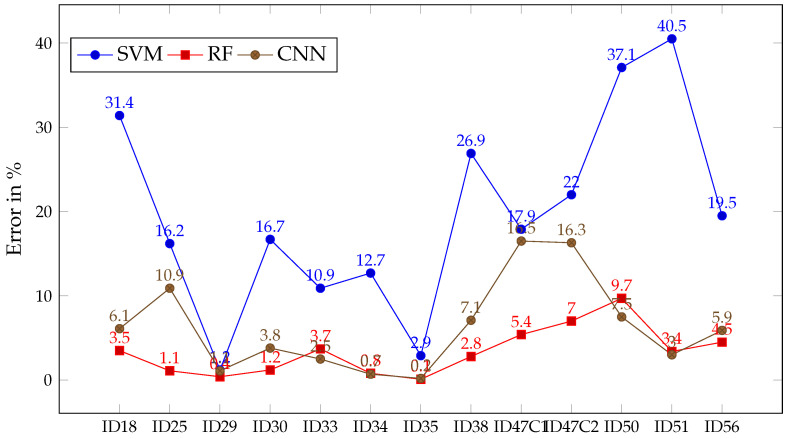
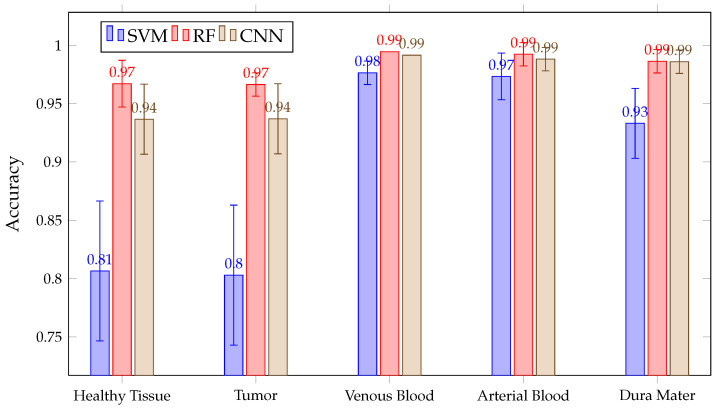
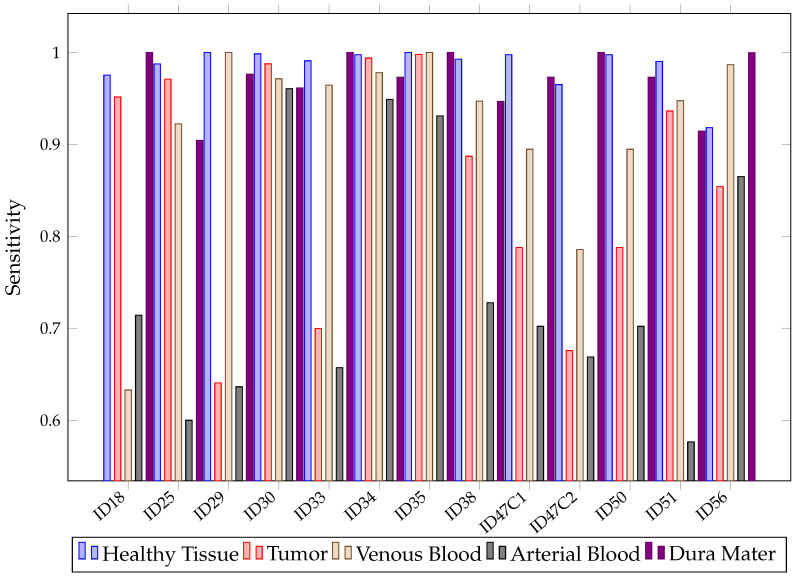
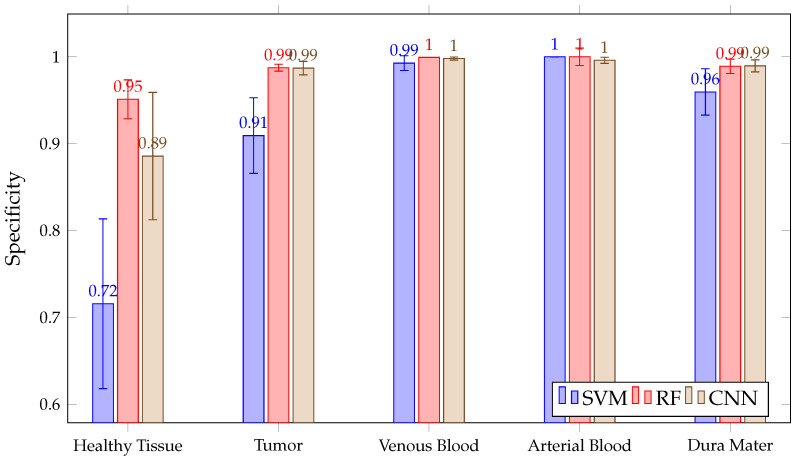
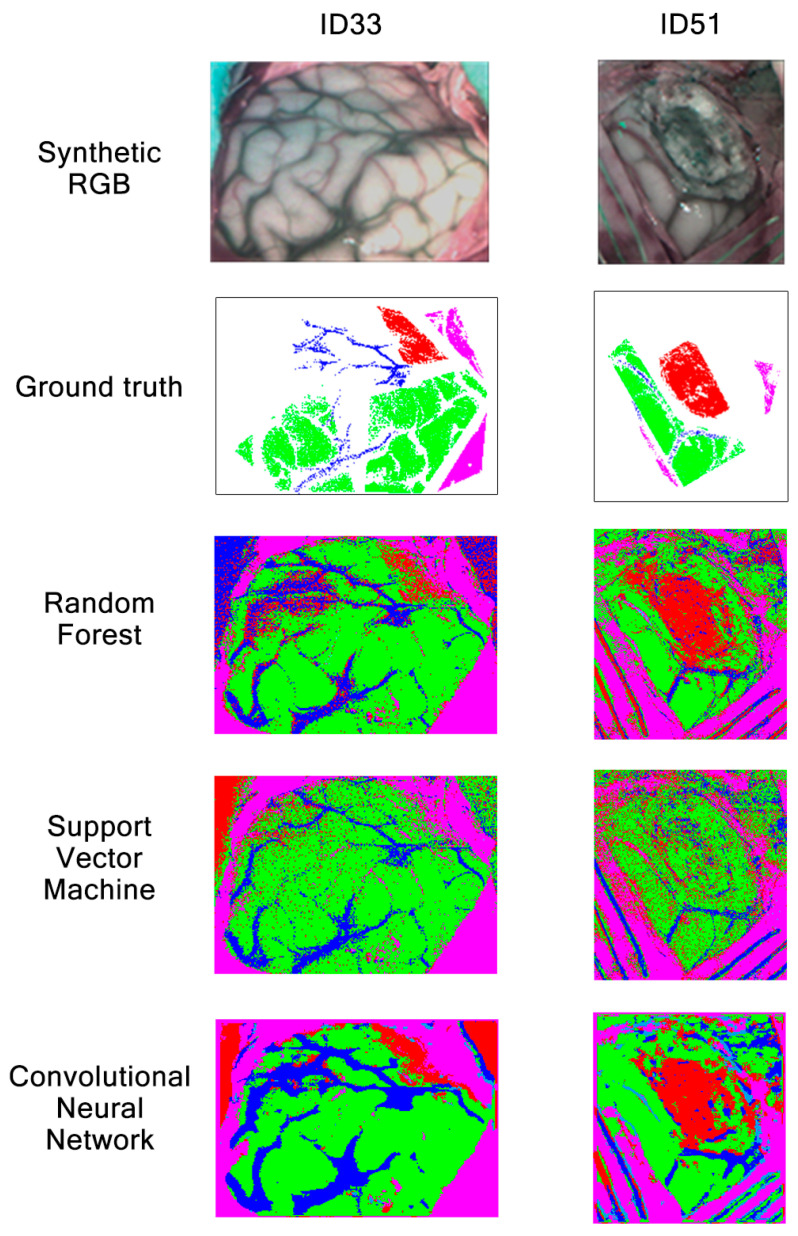
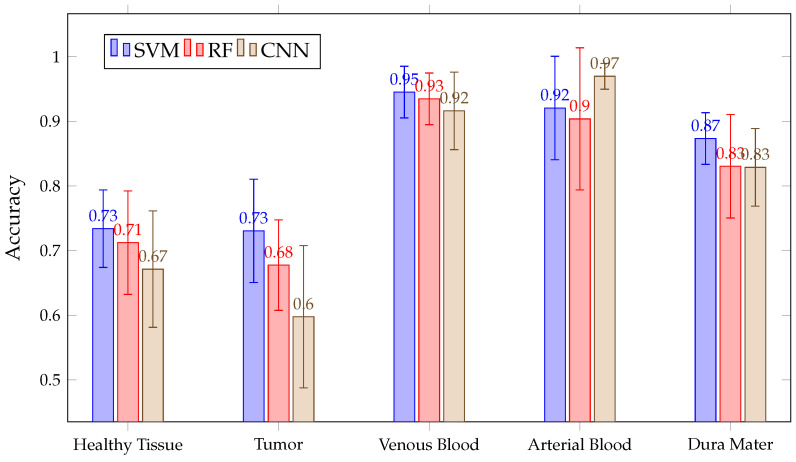
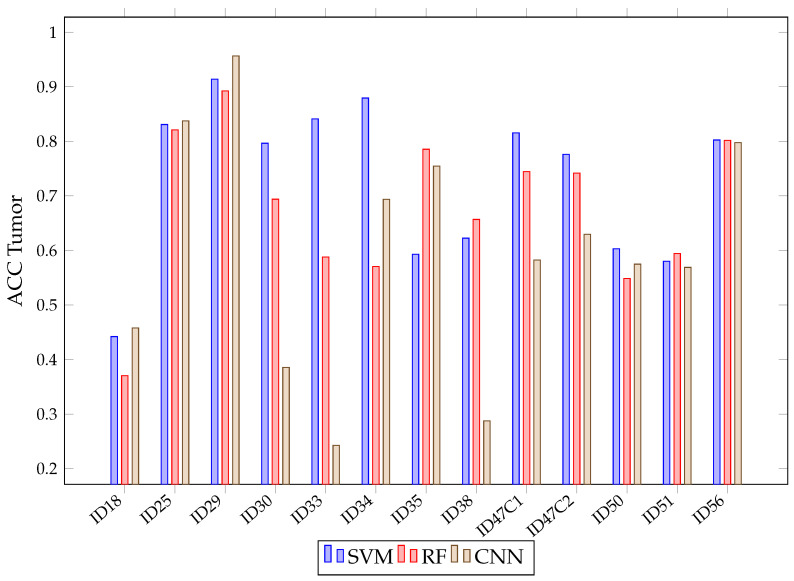
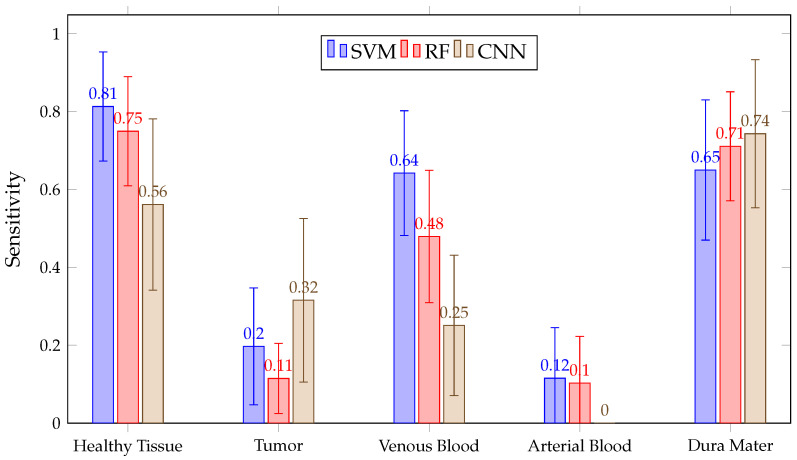
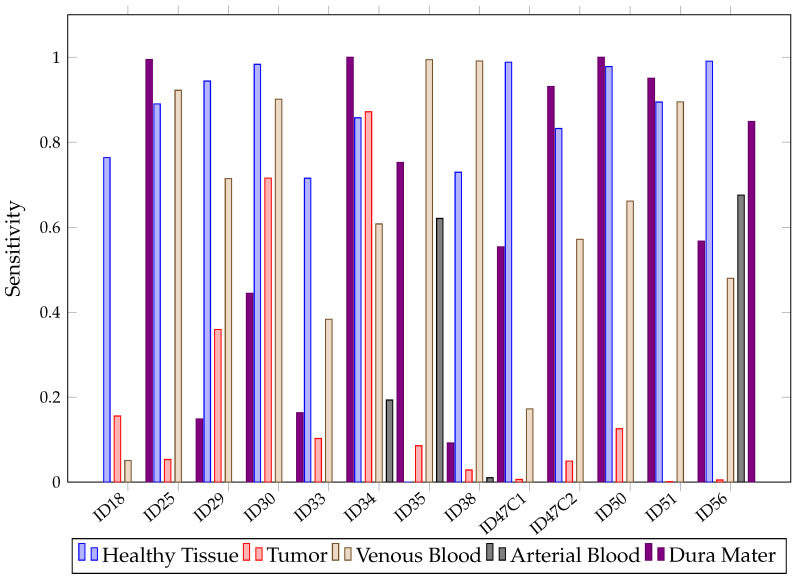
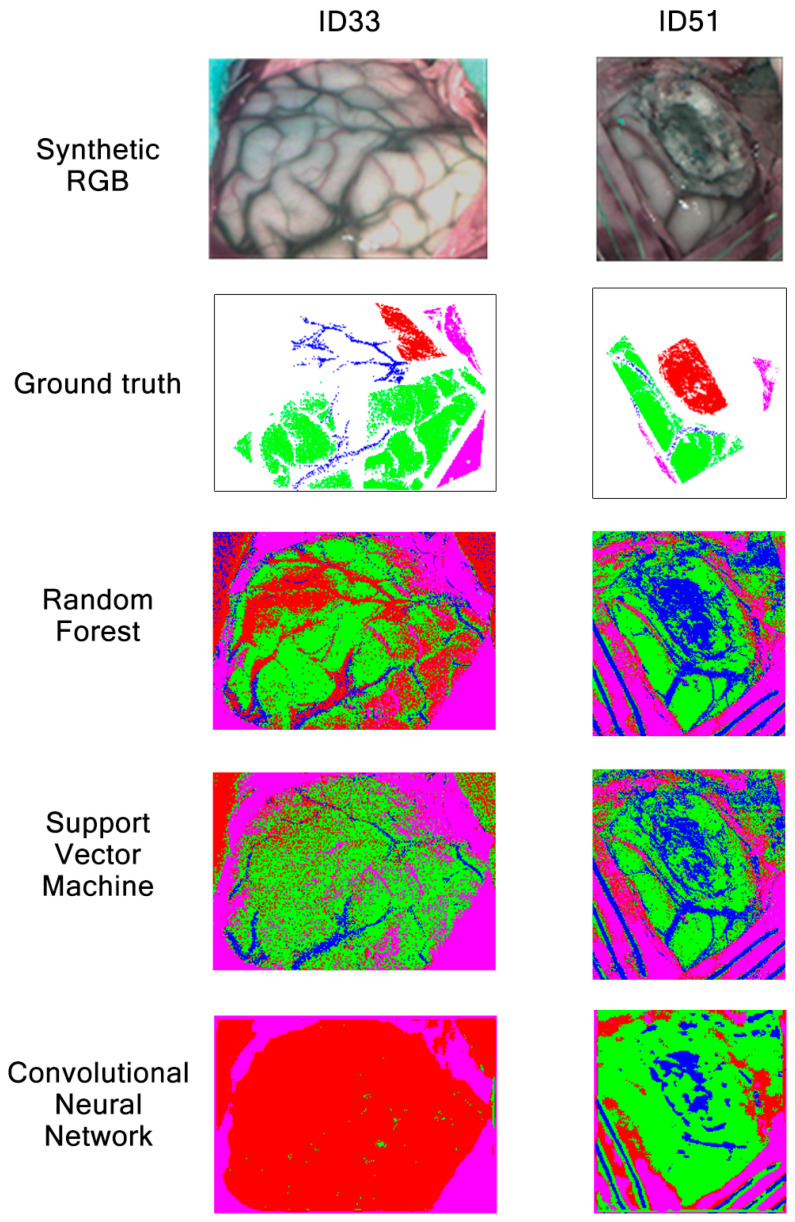
Hyperspectral imaging techniques (HSI) do not require contact with patients and are non-ionizing as well as non-invasive. As a consequence, they have been extensively applied in the medical field. HSI is being combined with machine learning (ML) processes to obtain models to assist in diagnosis. In particular, the combination of these techniques has proven to be a reliable aid in the differentiation of healthy and tumor tissue during brain tumor surgery. ML algorithms such as support vector machine (SVM), random forest (RF) and convolutional neural networks (CNN) are used to make predictions and provide in-vivo visualizations that may assist neurosurgeons in being more precise, hence reducing damages to healthy tissue. In this work, thirteen in-vivo hyperspectral images from twelve different patients with high-grade gliomas (grade III and IV) have been selected to train SVM, RF and CNN classifiers. Five different classes have been defined during the experiments: healthy tissue, tumor, venous blood vessel, arterial blood vessel and dura mater. Overall accuracy (OACC) results vary from 60% to 95% depending on the training conditions. Finally, as far as the contribution of each band to the OACC is concerned, the results obtained in this work are 3.81 times greater than those reported in the literature.
Keywords: brain; classification; convolutional neural network; hyperspectral imaging; machine learning; neurosurgery; random forest; support vector machine; tumor.
Conflict of interest statement
The authors declare no conflict of interest.
Figures
Similar articles
-
Blood Stain Classification with Hyperspectral Imaging and Deep Neural Networks.Sensors (Basel). 2020 Nov 21;20(22):6666. doi: 10.3390/s20226666. Sensors (Basel). 2020. PMID: 33233358 Free PMC article.
-
Non-destructive detection and classification of textile fibres based on hyperspectral imaging and 1D-CNN.Anal Chim Acta. 2022 Sep 1;1224:340238. doi: 10.1016/j.aca.2022.340238. Epub 2022 Aug 8. Anal Chim Acta. 2022. PMID: 35998989
-
Deep convolutional neural network based hyperspectral brain tissue classification.J Xray Sci Technol. 2023;31(4):777-796. doi: 10.3233/XST-230045. J Xray Sci Technol. 2023. PMID: 37182861
-
A review of the medical hyperspectral imaging systems and unmixing algorithms' in biological tissues.Photodiagnosis Photodyn Ther. 2021 Mar;33:102165. doi: 10.1016/j.pdpdt.2020.102165. Epub 2020 Dec 28. Photodiagnosis Photodyn Ther. 2021. PMID: 33383204 Review.
-
Hyperspectral Imaging in Brain Tumor Surgery-Evidence of Machine Learning-Based Performance.World Neurosurg. 2023 Jul;175:e614-e635. doi: 10.1016/j.wneu.2023.03.149. Epub 2023 Apr 6. World Neurosurg. 2023. PMID: 37030483
Cited by
-
Intraoperative tissue classification methods in orthopedic and neurological surgeries: A systematic review.Front Surg. 2022 Aug 3;9:952539. doi: 10.3389/fsurg.2022.952539. eCollection 2022. Front Surg. 2022. PMID: 35990097 Free PMC article. Review.
-
Endoscopic Hyperspectral Imaging System to Discriminate Tissue Characteristics in Tissue Phantom and Orthotopic Mouse Pancreatic Tumor Model.Bioengineering (Basel). 2024 Feb 23;11(3):208. doi: 10.3390/bioengineering11030208. Bioengineering (Basel). 2024. PMID: 38534482 Free PMC article.
-
HeiPorSPECTRAL - the Heidelberg Porcine HyperSPECTRAL Imaging Dataset of 20 Physiological Organs.Sci Data. 2023 Jun 24;10(1):414. doi: 10.1038/s41597-023-02315-8. Sci Data. 2023. PMID: 37355750 Free PMC article.
-
Technological Frontiers in Brain Cancer: A Systematic Review and Meta-Analysis of Hyperspectral Imaging in Computer-Aided Diagnosis Systems.Diagnostics (Basel). 2024 Aug 28;14(17):1888. doi: 10.3390/diagnostics14171888. Diagnostics (Basel). 2024. PMID: 39272675 Free PMC article. Review.
-
Precision Imaging for Early Detection of Esophageal Cancer.Bioengineering (Basel). 2025 Jan 20;12(1):90. doi: 10.3390/bioengineering12010090. Bioengineering (Basel). 2025. PMID: 39851364 Free PMC article.
References
-
- SEOM Las Cifras del Cáncer en España 2020. [(accessed on 31 May 2021)]; Available online: https://seom.org/seomcms/images/stories/recursos/Cifrasdelcancer2020.pdf.
MeSH terms
Grants and funding
LinkOut - more resources
Full Text Sources
Medical
Research Materials
