. 2021 May 26;22(11):5633.
doi: 10.3390/ijms22115633.

A Fair Assessment of Evaluation Tools for the Murine Microbead Occlusion Model of Glaucoma

Affiliations

A Fair Assessment of Evaluation Tools for the Murine Microbead Occlusion Model of Glaucoma

Marie Claes et al. Int J Mol Sci. .

Abstract

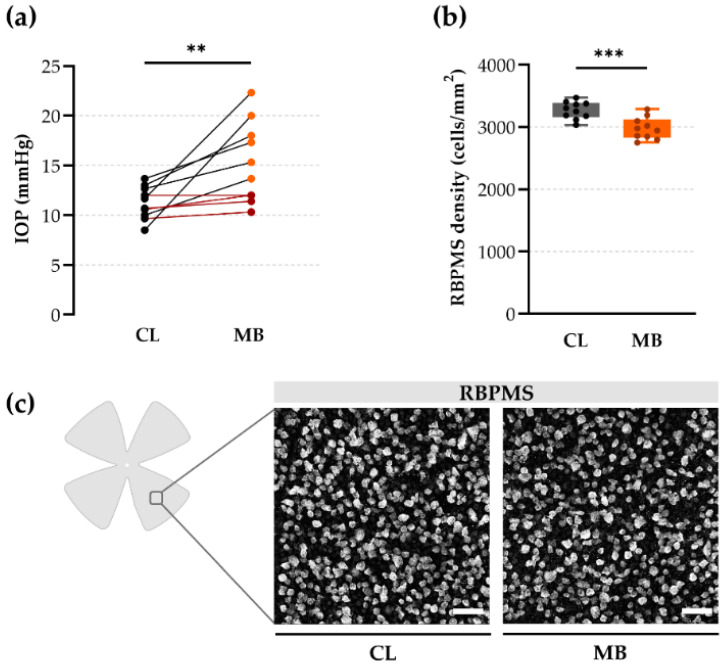
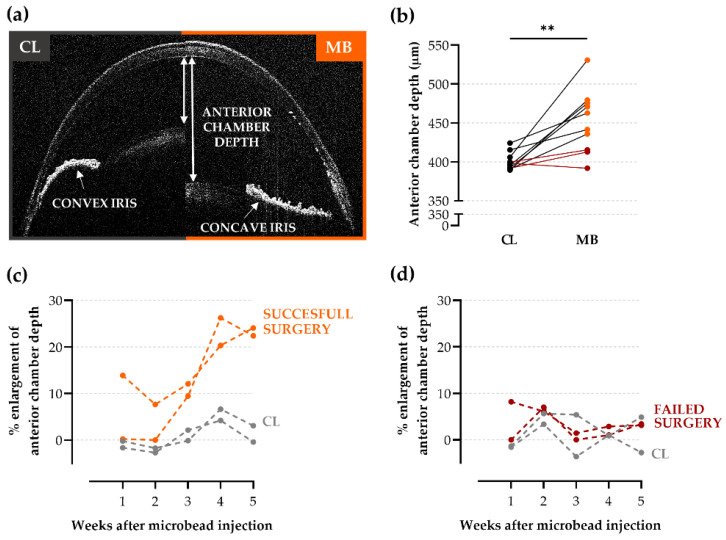
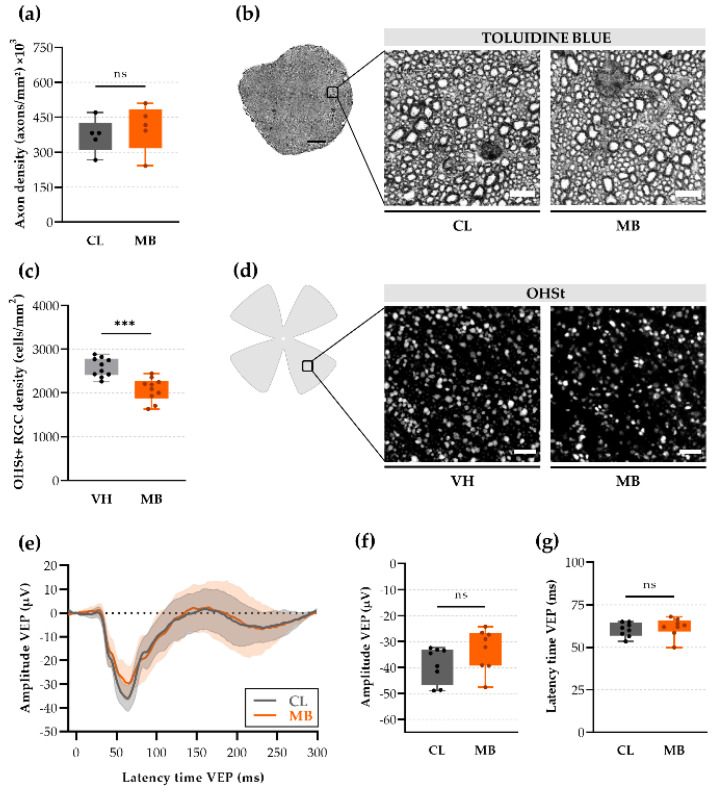
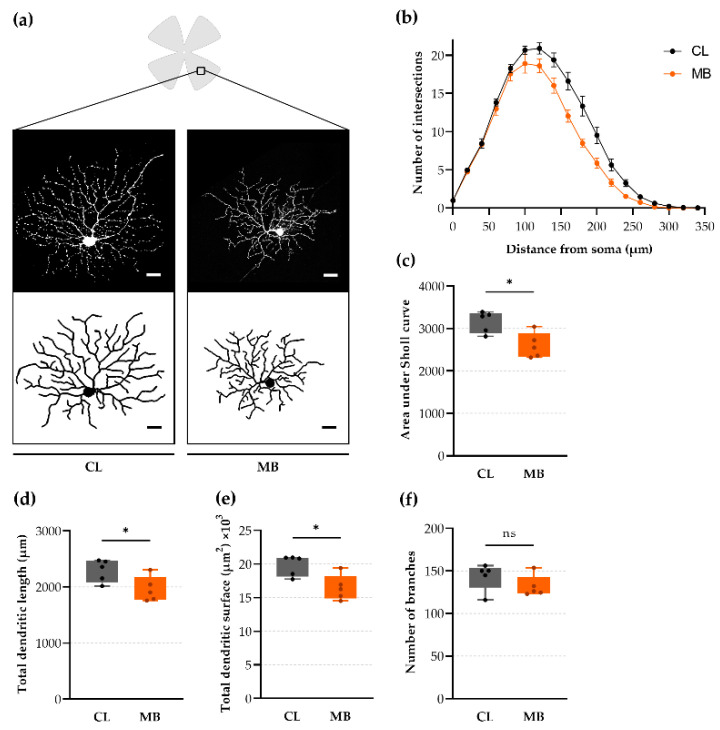
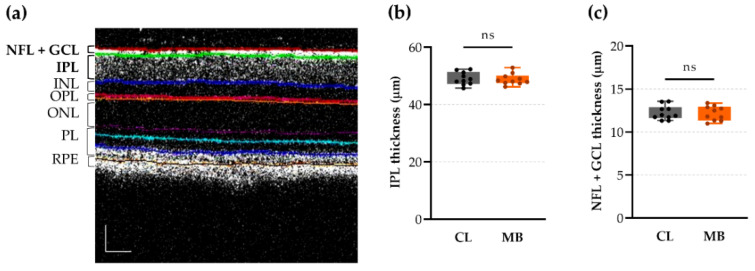
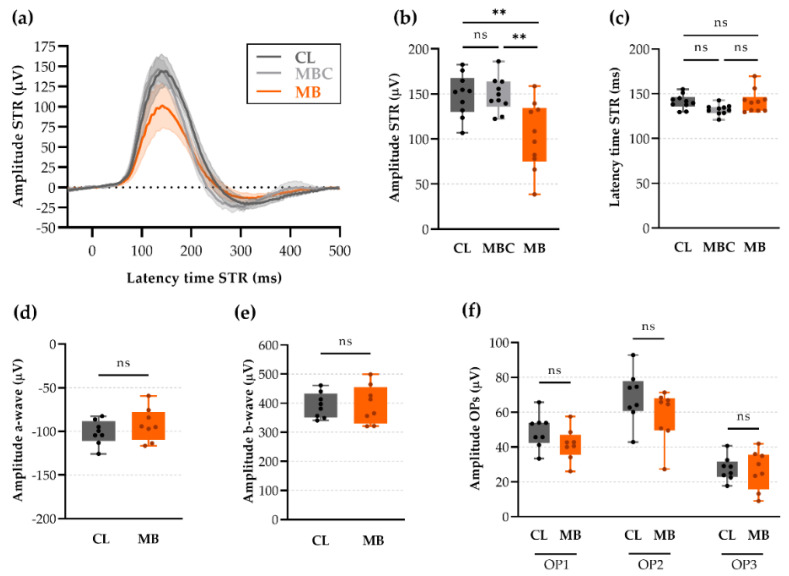
Despite being one of the most studied eye diseases, clinical translation of glaucoma research is hampered, at least in part, by the lack of validated preclinical models and readouts. The most popular experimental glaucoma model is the murine microbead occlusion model, yet the observed mild phenotype, mixed success rate, and weak reproducibility urge for an expansion of available readout tools. For this purpose, we evaluated various measures that reflect early onset glaucomatous changes in the murine microbead occlusion model. Anterior chamber depth measurements and scotopic threshold response recordings were identified as an outstanding set of tools to assess the model's success rate and to chart glaucomatous damage (or neuroprotection in future studies), respectively. Both are easy-to-measure, in vivo tools with a fast acquisition time and high translatability to the clinic and can be used, whenever judged beneficial, in combination with the more conventional measures in present-day glaucoma research (i.e., intraocular pressure measurements and post-mortem histological analyses). Furthermore, we highlighted the use of dendritic arbor analysis as an alternative histological readout for retinal ganglion cell density counts.

Keywords: anterior chamber depth; dendritic retraction; electroretinography; glaucoma; microbead occlusion model; neurodegeneration; ocular hypertension; optical coherence tomography; retinal ganglion cells; scotopic threshold response.


Conflict of interest statement

The authors declare no conflict of interest.

Figures

Figure 1
Figure 1
Intracameral microbead injection led to a mild glaucoma phenotype. (a) Intraocular pressure (IOP), measured with a rebound tonometer, was increased in microbead-injected eyes at two weeks post-injection, in comparison to the contralateral eyes. Of the 10 mice, 4 did not show elevated IOP (defined as an IOP lower than the mean IOP value of the contralateral eye + one standard deviation) (shown in red). Unpaired two-tailed t-test, ** p ≤ 0.01, n = 10. (b) RGC density of entire RBPMS-stained flatmounts was calculated by an automated deep learning tool (RGCode) [13] and revealed a mild RGC loss at five weeks post-injection, as compared to contralateral eyes. Unpaired two-tailed t-test, *** p ≤ 0.001, n = 10. (c) Representative photomicrographs of mid-peripheral regions of RBPMS-stained flatmounts revealed no evidently visible changes in RGC densities across contralateral control and microbead-injected eyes. Scale bar = 50 µm. CL = contralateral eyes and MB = microbead-injected eyes.
Figure 2
Figure 2
Optical coherence tomography (OCT) of the anterior segment at five weeks after microbead injection. (a) Representative anterior segment OCT images of a microbead-injected (right panel, “MB”) and contralateral (left panel, “CL”) eye after pupil dilatation. The measurements of the anterior chamber depth (i.e., the distance between the corneal endothelium and the anterior surface of the lens) are indicated, together with a clear example of a convex iris in a naïve eye vs. a concave, flattened iris after microbead injection. (b) Quantification of the anterior chamber depth at five weeks post-injection revealed a substantial enlargement (13 ± 3%) in microbead-injected eyes as compared to the control eyes. Of the 10 mice, 3 did not show elevated anterior chamber depth (defined as anterior chamber depth smaller than the mean anterior chamber depth of the contralateral eye + one standard deviation) (shown in red). Unpaired two-tailed t-test, ** p ≤ 0.01, n = 10. (c,d) Representative graphs of longitudinal anterior chamber depth follow-up showing the percentage of anterior chamber depth enlargement of mice with a successful (c) and failed (d) microbead surgery, both in comparison to the contralateral eyes. CL = contralateral eyes and MB = microbead-injected eyes.
Figure 3
Figure 3
Axonal stress at five weeks after microbead injection. (a) Axon density was calculated by an automated deep learning tool (AxoNet) [15] and revealed an unaltered density in the distal optic nerve (3 mm after optic nerve head) upon microbead injection. Unpaired two-tailed t-tests, ns = non-significant, n = 5. (b) Representative images of semi-thin optic nerve cross-sections (contralateral vs. microbead-injected optic nerves) revealed no clear signs of axon degeneration. Scale bar = 5 µm. (c) OHSt-labeled (OHSt+) RGC density after retrograde tracing from the superior colliculus was calculated by an automated deep learning tool (RGCode) [13] on entire flatmounts and revealed that axonal transport was notably disrupted in microbead-injected eyes as compared to vehicle-injected controls. Unpaired two-tailed t-test, *** p ≤ 0.001, n = 10. (d) Representative images of mid-peripheral retinal regions after retrograde OHSt tracing revealed a diminished number of OHSt+ RGCs after microbead injection. Scale bar = 50 µm. (e) Average (± CI95%) full-field flash visually evoked potential (VEP) responses indicated a non-significant but slightly decreased amplitude upon microbead injection as compared to contralateral controls. (f,g) The amplitude and latency of the VEP response remained unaltered upon microbead injection. Unpaired two-tailed t-test, ns = non-significant, n = 8. CL = contralateral eyes, VH = vehicle-injected eyes, and MB = microbead-injected eyes.
Figure 4
Figure 4
Dendritic architecture was affected by microbead injection. (a) Z-stack projection of αRGCs (SMI32-immunopositive) from a Thy1-YFP-H sparsely labeled mouse in the peripheral retina, together with the corresponding en-face view of the dendritic tree, traced with Matlab’s TREES toolbox. Scale bar = 20 µm. (b,c) Average (± SEM) Sholl profiles (b) (i.e., the number of dendrites intersecting concentric circles with a radius increment of 20 µm) and area under the Sholl curve (c) revealed dendritic retraction upon microbead injection. (df) Dendritic arbor analysis revealed a markedly lower dendritic length (d) and tree surface (c), whilst a trend towards a lower number of branches was observed (e). Unpaired two-tailed t-tests, ns = non-significant, * p ≤ 0.05, n = 5. CL = contralateral eyes and MB = microbead-injected eyes.
Figure 5
Figure 5
In vivo quantification of retinal layer thickness via optical coherence tomography (OCT) revealed no changes at five weeks after microbead injection. (a) Representative OCT image with colored lines indicating the borders of different retinal layers. Scale bar = 50 µm. (b) The inner plexiform layer (IPL) thickness was unchanged upon microbead injection. Unpaired two-tailed t-test, ns = non-significant, n = 10. (c) Similarly, the thickness of the combined nerve fiber and ganglion cell layers (NFL + GCL) remained unaltered after microbead injection. Unpaired two-tailed t-test, ns = non-significant, n = 10. CL = contralateral eyes and MB = microbead-injected eyes.
Figure 6
Figure 6
Scotopic threshold response (STR) and full-field flash electroretinogram (ERG) recordings five weeks after microbead injection. (a) Average (± CI95%) STRs showed a decreased amplitude upon microbead injection. (b,c) Bar graphs showing a decreased mean STR amplitude and unaltered mean STR latency time in microbead-injected eyes vs. contralateral and microbead-injected controls. One-way ANOVA test with Tukey’s post-hoc tests, ns = non-significant, ** p ≤ 0.01, n = 10. (df) Bar graphs showing components of the full-field flash ERG, generated primarily by photoreceptor (a-wave, (d)), Müller/ON-bipolar (b-wave, (e)), and amacrine (oscillatory potentials, OPs, (f)) cells, revealing unaltered responses of other retinal cells. Unpaired two-tailed t-tests (d,e) or one-way ANOVA test with Tukey’s post-hoc tests (f), ns = non-significant, n = 8. CL = contralateral eyes, MBC = microbead-injected control eyes without microbead repositioning towards trabecular meshwork, and MB = microbead-injected eyes.

Similar articles

Cited by

References

    1. Pang I.-H., Clark A.F. Inducible rodent models of glaucoma. Prog. Retin. Eye Res. 2020;75:100799. doi: 10.1016/j.preteyeres.2019.100799. - DOI - PMC - PubMed
    1. Evangelho K., Mastronardi C.A., De-la-Torre A. Experimental Models of Glaucoma: A Powerful Translational Tool for the Future Development of New Therapies for Glaucoma in Humans—A Review of the Literature. Medicina. 2019;55:280. doi: 10.3390/medicina55060280. - DOI - PMC - PubMed
    1. Cone F.E., Gelman S.E., Son J.L., Pease M.E., Quigley H.A. Differential susceptibility to experimental glaucoma among 3 mouse strains using bead and viscoelastic injection. Exp. Eye Res. 2010;91:415–424. doi: 10.1016/j.exer.2010.06.018. - DOI - PMC - PubMed
    1. Frankfort B.J., Khan A.K., Tse D.Y., Chung I., Pang J.-J., Yang Z., Gross R.L., Wu S.M. Elevated Intraocular Pressure Causes Inner Retinal Dysfunction Before Cell Loss in a Mouse Model of Experimental Glaucoma. Investig. Opthalmol. Vis. Sci. 2013;54:762. doi: 10.1167/iovs.12-10581. - DOI - PMC - PubMed
    1. Wang R., Seifert P., Jakobs T.C. Astrocytes in the Optic Nerve Head of Glaucomatous Mice Display a Characteristic Reactive Phenotype. Investig. Opthalmol. Vis. Sci. 2017;58:924. doi: 10.1167/iovs.16-20571. - DOI - PMC - PubMed

Publication types