Osmolyte Signatures for the Protection of Aspergillus sydowii Cells under Halophilic Conditions and Osmotic Shock
- PMID: 34073303
- PMCID: PMC8228332
- DOI: 10.3390/jof7060414
Osmolyte Signatures for the Protection of Aspergillus sydowii Cells under Halophilic Conditions and Osmotic Shock
Abstract
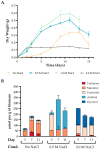
Aspergillus sydowii is a moderate halophile fungus extensively studied for its biotechnological potential and halophile responses, which has also been reported as a coral reef pathogen. In a recent publication, the transcriptomic analysis of this fungus, when growing on wheat straw, showed that genes related to cell wall modification and cation transporters were upregulated under hypersaline conditions but not under 0.5 M NaCl, the optimal salinity for growth in this strain. This led us to study osmolyte accumulation as a mechanism to withstand moderate salinity. In this work, we show that A. sydowii accumulates trehalose, arabitol, mannitol, and glycerol with different temporal dynamics, which depend on whether the fungus is exposed to hypo- or hyperosmotic stress. The transcripts coding for enzymes responsible for polyalcohol synthesis were regulated in a stress-dependent manner. Interestingly, A. sydowii contains three homologs (Hog1, Hog2 and MpkC) of the Hog1 MAPK, the master regulator of hyperosmotic stress response in S. cerevisiae and other fungi. We show a differential regulation of these MAPKs under different salinity conditions, including sustained basal Hog1/Hog2 phosphorylation levels in the absence of NaCl or in the presence of 2.0 M NaCl, in contrast to what is observed in S. cerevisiae. These findings indicate that halophilic fungi such as A. sydowii utilize different osmoadaptation mechanisms to hypersaline conditions.
Keywords: Aspergillus; HOG; extremophile; halophile; osmolyte; osmotic shock.
Conflict of interest statement
The authors declare no conflict of interest. Also, the funders had no role in the design of the study; in the collection, analyses, or interpretation of data; in the writing of the manuscript, or in the decision to publish the results.
Figures


Similar articles
-
Surviving in the Brine: A Multi-Omics Approach for Understanding the Physiology of the Halophile Fungus Aspergillus sydowii at Saturated NaCl Concentration.Front Microbiol. 2022 May 2;13:840408. doi: 10.3389/fmicb.2022.840408. eCollection 2022. Front Microbiol. 2022. PMID: 35586858 Free PMC article.
-
Haloadaptative Responses of Aspergillus sydowii to Extreme Water Deprivation: Morphology, Compatible Solutes, and Oxidative Stress at NaCl Saturation.J Fungi (Basel). 2020 Nov 27;6(4):316. doi: 10.3390/jof6040316. J Fungi (Basel). 2020. PMID: 33260894 Free PMC article.
-
Stress Reshapes the Physiological Response of Halophile Fungi to Salinity.Cells. 2020 Feb 25;9(3):525. doi: 10.3390/cells9030525. Cells. 2020. PMID: 32106416 Free PMC article.
-
Secondary Metabolites, Biological Activities, and Industrial and Biotechnological Importance of Aspergillus sydowii.Mar Drugs. 2023 Aug 5;21(8):441. doi: 10.3390/md21080441. Mar Drugs. 2023. PMID: 37623723 Free PMC article. Review.
-
Sensing and Responding to Hypersaline Conditions and the HOG Signal Transduction Pathway in Fungi Isolated from Hypersaline Environments: Hortaea werneckii and Wallemia ichthyophaga.J Fungi (Basel). 2021 Nov 19;7(11):988. doi: 10.3390/jof7110988. J Fungi (Basel). 2021. PMID: 34829275 Free PMC article. Review.
Cited by
-
Surviving in the Brine: A Multi-Omics Approach for Understanding the Physiology of the Halophile Fungus Aspergillus sydowii at Saturated NaCl Concentration.Front Microbiol. 2022 May 2;13:840408. doi: 10.3389/fmicb.2022.840408. eCollection 2022. Front Microbiol. 2022. PMID: 35586858 Free PMC article.
-
Structural adaptation of fungal cell wall in hypersaline environment.Nat Commun. 2023 Nov 4;14(1):7082. doi: 10.1038/s41467-023-42693-6. Nat Commun. 2023. PMID: 37925437 Free PMC article.
-
Achog1 is required for the asexual sporulation, stress responses and pigmentation of Aspergillus cristatus.Front Microbiol. 2022 Nov 25;13:1003244. doi: 10.3389/fmicb.2022.1003244. eCollection 2022. Front Microbiol. 2022. PMID: 36504805 Free PMC article.
-
Insight into the adaptation mechanisms of high hydrostatic pressure in physiology and metabolism of hadal fungi from the deepest ocean sediment.mSystems. 2024 Jan 23;9(1):e0108523. doi: 10.1128/msystems.01085-23. Epub 2023 Dec 20. mSystems. 2024. PMID: 38117068 Free PMC article.
-
Impact of key parameters involved with plant-microbe interaction in context to global climate change.Front Microbiol. 2022 Sep 30;13:1008451. doi: 10.3389/fmicb.2022.1008451. eCollection 2022. Front Microbiol. 2022. PMID: 36246210 Free PMC article. Review.
References
-
- Brown A.D., Mackenzie K.F., Singh K.K. Selected aspects of microbial osmoregulation. FEMS Microbiol. Lett. 1986;39:31–36. doi: 10.1111/j.1574-6968.1986.tb01839.x. - DOI
Grants and funding
LinkOut - more resources
Full Text Sources

