

Predicting Deliquescence Relative Humidities of Crystals and Crystal Mixtures
- PMID: 34073307
- PMCID: PMC8198525
- DOI: 10.3390/molecules26113176
Predicting Deliquescence Relative Humidities of Crystals and Crystal Mixtures
Abstract
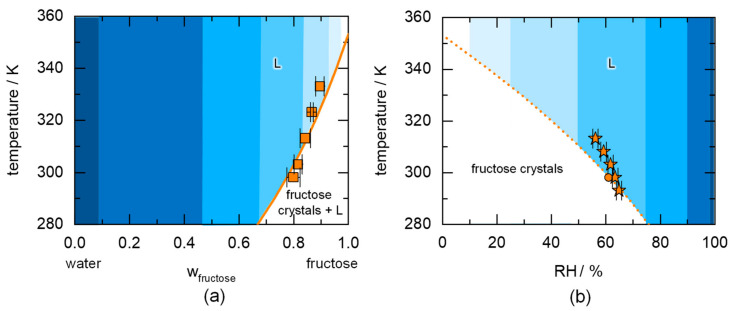
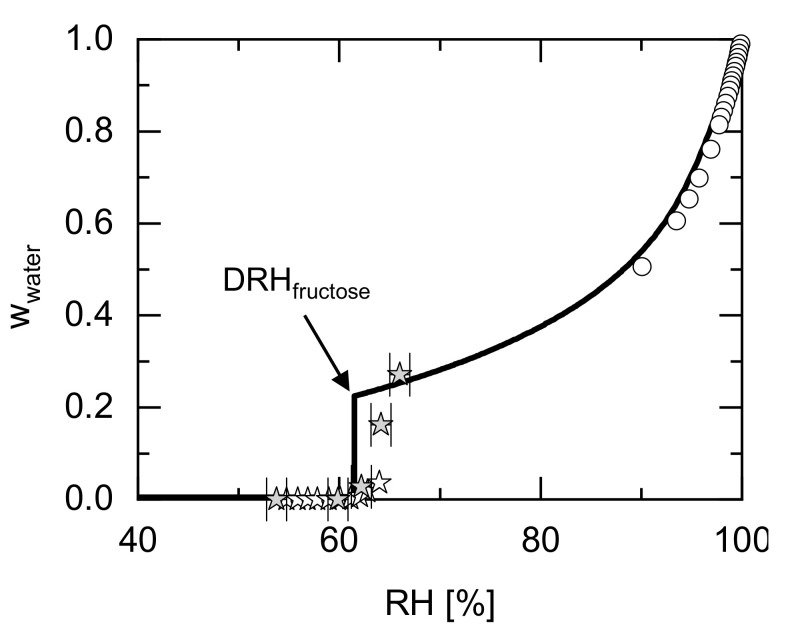
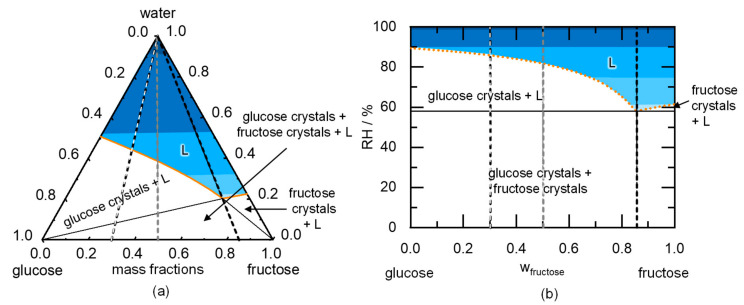
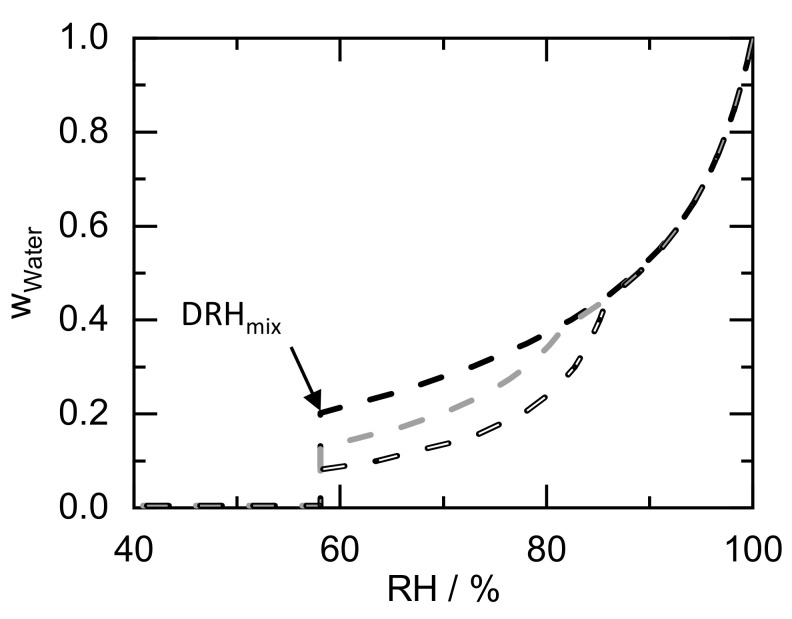
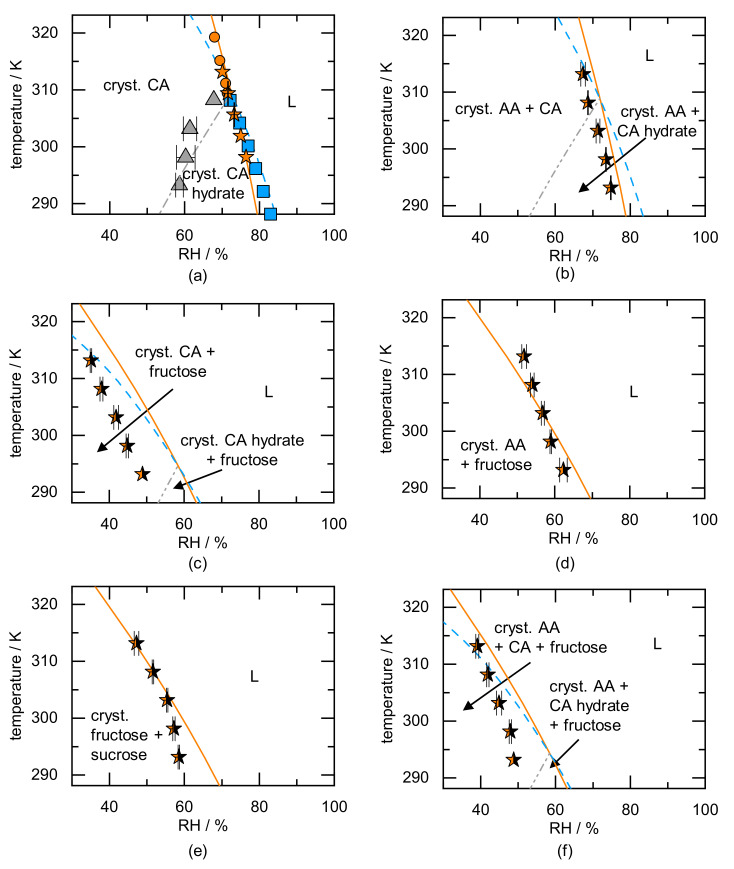
The presence of water in the form of relative humidity (RH) may lead to deliquescence of crystalline components above a certain RH, the deliquescence RH (DRH). Knowing the DRH values is essential, e.g., for the agrochemical industry, food industry, and pharmaceutical industry to identify stability windows for their crystalline products. This work applies the Perturbed-Chain Statistical Associating Fluid Theory (PC-SAFT) to purely predict the DRH of single components (organic acids, sugars, artificial sweeteners, and amides) and multicomponent crystal mixtures thereof only based on aqueous solubility data of the pure components. The predicted DRH values very well agree with the experimental ones. In addition, the temperature influence on the DRH value could be successfully predicted with PC-SAFT. The DRH prediction also differentiates between formation of hydrates and anhydrates. PC-SAFT-predicted phase diagrams of hydrate-forming components illustrate the influence of additional components on the hydrate formation as a function of RH. The DRH prediction via PC-SAFT allows for the determining of the stability of crystals and crystal mixtures without the need for time-consuming experiments.
Keywords: PC-SAFT; crystal; crystal mixture; deliquescence; thermodynamics; vapor sorption.
Conflict of interest statement
The authors declare no conflict of interest.
Figures
Similar articles
-
Stability of Pharmaceutical Co-Crystals at Humid Conditions Can Be Predicted.Pharmaceutics. 2021 Mar 23;13(3):433. doi: 10.3390/pharmaceutics13030433. Pharmaceutics. 2021. PMID: 33806996 Free PMC article.
-
Long-Term Physical Stability of PVP- and PVPVA-Amorphous Solid Dispersions.Mol Pharm. 2017 Jan 3;14(1):157-171. doi: 10.1021/acs.molpharmaceut.6b00763. Epub 2016 Dec 7. Mol Pharm. 2017. PMID: 28043133
-
Mutual Impact of Phase Separation/Crystallization and Water Sorption in Amorphous Solid Dispersions.Mol Pharm. 2018 Feb 5;15(2):669-678. doi: 10.1021/acs.molpharmaceut.7b01076. Epub 2018 Jan 19. Mol Pharm. 2018. PMID: 29309155
-
Deliquescence of pharmaceutical systems.Pharm Dev Technol. 2010 Dec;15(6):582-94. doi: 10.3109/10837450903397594. Epub 2009 Nov 6. Pharm Dev Technol. 2010. PMID: 19895256 Review.
-
Water-solids interactions: deliquescence.Annu Rev Food Sci Technol. 2010;1:41-63. doi: 10.1146/annurev.food.080708.100915. Annu Rev Food Sci Technol. 2010. PMID: 22129329 Review.
Cited by
-
Softness of hydrated salt crystals under deliquescence.Nat Commun. 2023 Feb 25;14(1):1090. doi: 10.1038/s41467-023-36834-0. Nat Commun. 2023. PMID: 36841912 Free PMC article.
-
Humidity drives spontaneous OH oxidation of organic particles.Sci Adv. 2025 Jun 20;11(25):eadx4507. doi: 10.1126/sciadv.adx4507. Epub 2025 Jun 20. Sci Adv. 2025. PMID: 40540571 Free PMC article.
-
Stability of Pharmaceutical Co-Crystals at Humid Conditions Can Be Predicted.Pharmaceutics. 2021 Mar 23;13(3):433. doi: 10.3390/pharmaceutics13030433. Pharmaceutics. 2021. PMID: 33806996 Free PMC article.
References
-
- Labuza T.P., Altunakar B. Water Activity Prediction and Moisture Sorption Isotherms. In: Barbosa-Cánovas G.V., editor. Water Activity in Foods: Fundamentals and Applications. 2nd ed. Wiley; Hoboken, NJ, USA: 2020. pp. 161–205.
-
- Adams J.R., Merz A.R. Hygroscopicity of Fertilizer Materials and Mixtures. Ind. Eng. Chem. 1929;21:305–307. doi: 10.1021/ie50232a003. - DOI
-
- Peng C., Chan C.K. The water cycles of water-soluble organic salts of atmospheric importance. Atmos. Environ. 2001;35:1183–1192. doi: 10.1016/S1352-2310(00)00426-X. - DOI
MeSH terms
Substances
LinkOut - more resources
Full Text Sources
