. 2021 May 26;9(6):75.
doi: 10.3390/sports9060075.

Does the Multistage 20-m Shuttle Run Test Accurately Predict VO2max in NCAA Division I Women Collegiate Field Hockey Athletes?

Affiliations

Does the Multistage 20-m Shuttle Run Test Accurately Predict VO2max in NCAA Division I Women Collegiate Field Hockey Athletes?

Meghan K Magee et al. Sports (Basel). .

Abstract

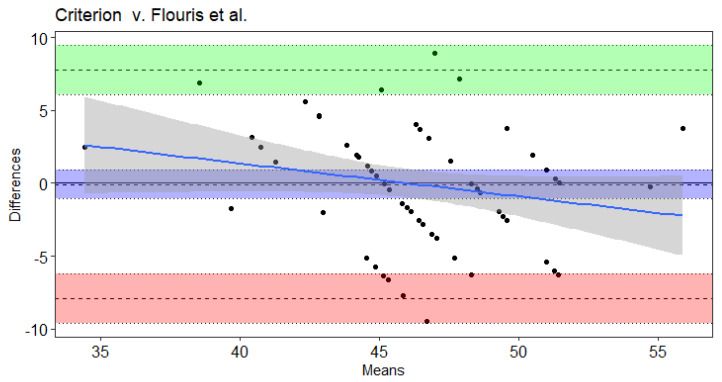
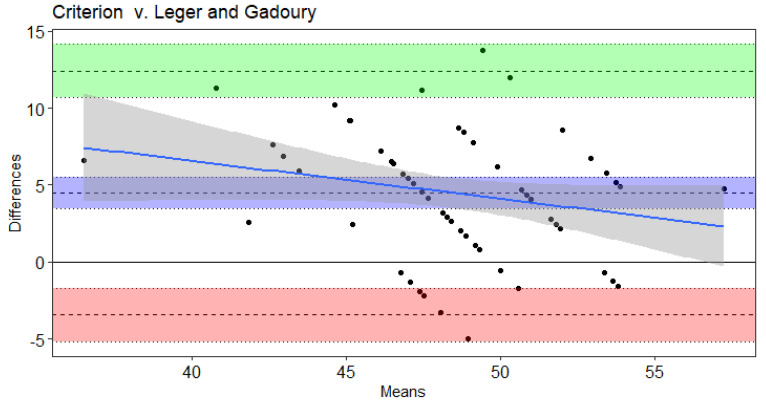
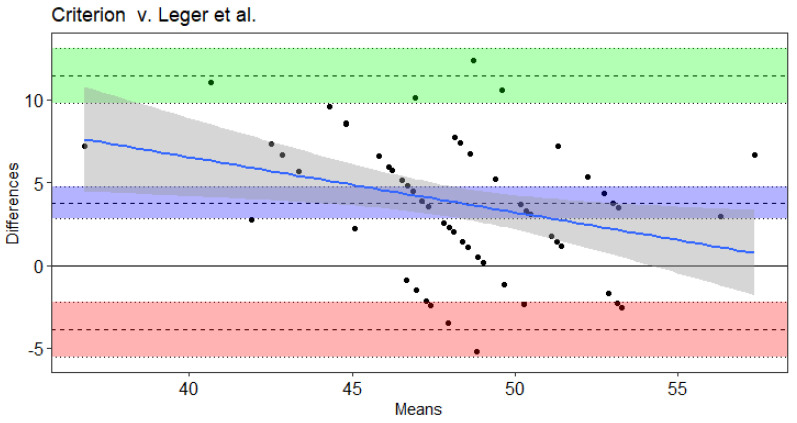
Laboratory assessments of maximal oxygen uptake (VO2max) are considered the "gold standard" for ascertaining cardiovascular fitness, but they are not always practical for use in team sport settings. Therefore, the purpose of the current study was to compare the criterion assessment of VO2max on a treadmill to the progressive, multistage 20-m shuttle run test (i.e., Beep test), and to determine the predictability of 6 previously established Beep test predictive equations (i.e., Chatterjee, Flouris, Leger, Leger and Gadoury, Ramsbottom, St. Clair-Gibson). Collegiate women field hockey athletes (n = 65, mean±SD: age 19.6 ± 1.2 years; weight 64.7 ± 6.1 kg) completed criterion VO2max (mean ± SD: 46.4 ± 4.6 mL·kg-1·min-1) and Beep tests to volitional fatigue. According to Bland-Altman and Ordinary Least Products Regressions, the Ramsbottom (46.5 ± 4.2 mL·kg-1·min-1) and Flouris (46.3 ± 3.8 mL·kg-1·min-1) equations were considered valid predictions of criterion measured VO2max (46.4 ± 4.6). The Chatterjee, Leger, Leger and Gadoury, and St. Clair-Gibson equations overestimated VO2max, and are not recommended for use with women collegiate field hockey athletes. The Ramsbottom and Flouris estimates of VO2max from 20-m shuttle performances may be used in this population. For accurate estimates of VO2max, the clientele's age, fitness level, and training history should be considered when selecting equations.

Keywords: Beep test; aerobic power; cardiovascular fitness; oxygen consumption; women athletes.


Conflict of interest statement

The authors declare no conflict of interest.

Figures

Figure 1
Figure 1
Bland–Altman plot of differences and means for criterion measured VO2max from a maximal incremental treadmill test and the Ramsbottom et al. Beep test algorithm. The 3 dotted lines with blue shading represent mean bias, green shading represents upper 95% threshold, and red shading represents lower 95% threshold. The center line is either the mean difference or [1.96 × SD of Differences]), while the dotted lines above and below the center are the respective 95% confidence intervals. The solid blue line and the gray shading represent the trendline of proportional bias and the proportional standard error of the slope estimates, respectively.
Figure 2
Figure 2
Bland–Altman plot of differences and means for criterion measured VO2max from a maximal incremental treadmill test and the Flouris et al. Beep test algorithm. The 3 dotted lines with blue shading represent mean bias, green shading represents upper 95% threshold, and red shading represents lower 95% threshold. The center line is either the mean difference or [1.96 × SD of Differences]), while the dotted lines above and below the center are the respective 95% confidence intervals. The solid blue line and the gray shading represent the trendline of proportional bias and the proportional standard error of the slope estimates, respectively.
Figure 3
Figure 3
Bland–Altman plot of differences and means for criterion measured VO2max from a maximal incremental treadmill test and the St. Clair Gibson et al. Beep test algorithm. The 3 dotted lines with blue shading represent mean bias, green shading represents upper 95% threshold, and red shading represents lower 95% threshold. The center line is either the mean difference or [1.96 × SD of Differences]), while the dotted lines above and below the center are the respective 95% confidence intervals. The solid blue line and the gray shading represent the trendline of proportional bias and the proportional standard error of the slope estimates, respectively.
Figure 4
Figure 4
Bland–Altman plot of differences and means for criterion measured VO2max from a maximal incremental treadmill test and the Leger and Gadoury Beep test algorithm. The 3 dotted lines with blue shading represent mean bias, green shading represents upper 95% threshold, and red shading represents lower 95% threshold. The center line is either the mean difference or [1.96 × SD of Differences]), while the dotted lines above and below the center are the respective 95% confidence intervals. The solid blue line and the gray shading represent the trendline of proportional bias and the proportional standard error of the slope estimates, respectively.
Figure 5
Figure 5
Bland–Altman plot of differences and means for criterion measured VO2max from a maximal incremental treadmill test and the Leger et al. Beep test algorithm. The 3 dotted lines with blue shading represent mean bias, green shading represents upper 95% threshold, and red shading represents lower 95% threshold. The center line is either the mean difference or [1.96 × SD of Differences]), while the dotted lines above and below the center are the respective 95% confidence intervals. The solid blue line and the gray shading represent the trendline of proportional bias and the proportional standard error of the slope estimates, respectively.
Figure 6
Figure 6
Bland–Altman plot of differences and means for criterion measured VO2max from a maximal incremental treadmill test and the Chatterjee et al. Beep test algorithm. The 3 dotted lines with blue shading represent mean bias, green shading represents upper 95% threshold, and red shading represents lower 95% threshold. The center line is either the mean difference or [1.96 × SD of Differences]), while the dotted lines above and below the center are the respective 95% confidence intervals. The solid blue line and the gray shading represent the trendline of proportional bias and the proportional standard error of the slope estimates, respectively.

Similar articles

Cited by

References

    1. Lemmink K.A.P.M., Visscher S.H. Role of Energy Systems in Two Intermittent Field Tests in Women Field Hockey Players. J. Strength Cond. Res. 2006;20:682–688. - PubMed
    1. Lothian F., Farrally M.R. A Comparison of Methods for Estimating Oxygen Uptake during Intermittent Exercise. J. Sports Sci. 1995;13:491–497. doi: 10.1080/02640419508732266. - DOI - PubMed
    1. Spencer M., Lawrence S., Rechichi C., Bishop D., Dawson B., Goodman C. Time-Motion Analysis of Elite Field Hockey, with Special Reference to Repeated-Sprint Activity. J. Sports Sci. 2004;22:843–850. doi: 10.1080/02640410410001716715. - DOI - PubMed
    1. Hinrichs T., Franke J., Voss S., Bloch W., Schänzer W., Platen P. Total Hemoglobin Mass, Iron Status, and Endurance Capacity in Elite Field Hockey Players. J. Strength Cond. Res. 2010;24:629–638. doi: 10.1519/JSC.0b013e3181a5bc59. - DOI - PubMed
    1. Reilly T., Borrie A. Physiology Applied to Field Hockey. Sports Med. 1992;14:10–26. doi: 10.2165/00007256-199214010-00002. - DOI - PubMed

LinkOut - more resources