. 2021 May 26;22(11):5661.
doi: 10.3390/ijms22115661.

A Confocal Microscopic Study of Gene Transfer into the Mesencephalic Tegmentum of Juvenile Chum Salmon, Oncorhynchus keta, Using Mouse Adeno-Associated Viral Vectors

Affiliations

A Confocal Microscopic Study of Gene Transfer into the Mesencephalic Tegmentum of Juvenile Chum Salmon, Oncorhynchus keta, Using Mouse Adeno-Associated Viral Vectors

Evgeniya V Pushchina et al. Int J Mol Sci. .

Abstract

To date, data on the presence of adenoviral receptors in fish are very limited. In the present work, we used mouse recombinant adeno-associated viral vectors (rAAV) with a calcium indicator of the latest generation GCaMP6m that are usually applied for the dorsal hippocampus of mice but were not previously used for gene delivery into fish brain. The aim of our work was to study the feasibility of transduction of rAAV in the mouse hippocampus into brain cells of juvenile chum salmon and subsequent determination of the phenotype of rAAV-labeled cells by confocal laser scanning microscopy (CLSM). Delivery of the gene in vivo was carried out by intracranial injection of a GCaMP6m-GFP-containing vector directly into the mesencephalic tegmentum region of juvenile (one-year-old) chum salmon, Oncorhynchus keta. AAV incorporation into brain cells of the juvenile chum salmon was assessed at 1 week after a single injection of the vector. AAV expression in various areas of the thalamus, pretectum, posterior-tuberal region, postcommissural region, medial and lateral regions of the tegmentum, and mesencephalic reticular formation of juvenile O. keta was evaluated using CLSM followed by immunohistochemical analysis of the localization of the neuron-specific calcium binding protein HuCD in combination with nuclear staining with DAPI. The results of the analysis showed partial colocalization of cells expressing GCaMP6m-GFP with red fluorescent HuCD protein. Thus, cells of the thalamus, posterior tuberal region, mesencephalic tegmentum, cells of the accessory visual system, mesencephalic reticular formation, hypothalamus, and postcommissural region of the mesencephalon of juvenile chum salmon expressing GCaMP6m-GFP were attributed to the neuron-specific line of chum salmon brain cells, which indicates the ability of hippocampal mammal rAAV to integrate into neurons of the central nervous system of fish with subsequent expression of viral proteins, which obviously indicates the neuronal expression of a mammalian adenoviral receptor homolog by juvenile chum salmon neurons.

Keywords: Oncorhynchus keta; adeno-associated virus; calcium binding protein HuCD; dorsal thalamus; hypothalamus; mesencephalic reticular formation; postcommissural region; posterior tuberal region; pretectal nuclei; tegmentum.


Conflict of interest statement

The authors declare no conflict of interest.

Figures

Figure 1
Figure 1
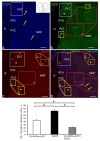
Z-stacks representing HuCD immunolabeling in the anterior hypothalamic ventricle of juvenile chum salmon, O. keta, at 1 week after a single injection of recombinant AAV in the mesencephalic tegmentum area. (A) DAPI staining; the pictogram shows the area of the anterior hypothalamus (outlined by red rectangle); the yellow rectangle outlines an aggregation of nuclei of the medial hypothalamus (MH), stained nuclei (orange arrows); LH is the lateral hypothalamus; constitutive clusters of nuclei are outlined by the white oval dotted line. (B) Expression of the green fluorescent protein (GFP) in hypothalamic cells (red arrows); the white dashed rectangle outlines cluster 1 in the medial zone; other boxes show clusters of 2, 4, and 3 (with inset at higher magnification) GFP+ cells in the lateral zone of the hypothalamus. (C) Control brain sections; in the animals that received an injection of 0.1% PBS, GCaMP6m-GFP was not labeled. (D) Immunofluorescence of the HuCD protein in hypothalamic neurons (green arrows); cluster 2 is shown with inset at higher magnification. (E) Control brain sections; in the animals with the lack of secondary antibodies, no HuCD immunolabeling was detected. (F) Superposition of three channels of DAPI/GFP/HuCD staining, showing the areas of GFP/HuCD colocalization in neurons (in the red rectangle). Laser scanning confocal microscopy. Scale bar: 200 µm. (G) Results of one-way analysis of variance (ANOVA test) showing the comparative distribution of labeled cells and nuclei (M ± SD, where M is the mean and SD is the standard deviation) of the anterior hypothalamic ventricle of chum salmon. Significant intergroup differences were found between groups of GCaMP6m-GFP+ and HuCD+ cells (# < 0.05), as well as between GCaMP6m-GFP+ and GCaMP6m-GFP+/HuCD+ cells (## < 0.01) (n = 5 in each group).
Figure 2
Figure 2
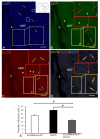
Z-stacks representing HuCD immunolabeling in the posterior tuberculum area of juvenile chum salmon, O. keta, at 1 week after a single injection of recombinant AAV into the mesencephalic tegmentum area. (A) DAPI staining, the pictogram shows the posterior tuberal area, morphologically heterogeneous nuclei forming dense clusters (in a white square), as well as multilayer clusters (outlined by pink dotted rectangle), abundantly vascularized (orange arrows), PVZ—periventricular zone, SVZ—subventricular zone, PTN—posterior tuberal nucleus. (B) PTN at higher magnification, heterogeneous nuclei with numerous nucleoli (white arrows), elongated nuclei of migrating cells (pink arrow). (C) Expression of green fluorescent protein GFP in PTA cells (red arrows), aggregation of GFP+ cells in SVZ (population № 1, yellow dashed rectangle) of heterogeneous composition (inset at high magnification), GFP+ neurons and nuclei in PTN (population № 2 in red rectangle), GFP+ granules (yellow arrowheads). (D) PTN at higher magnification, GFP+ nuclei (red triangular arrows). (E) Immunofluorescence of HuCD protein in PTA neurons (green arrows), population № 1 is shown with inset at higher magnification. (F) PTN at higher magnification. (G) Superposition of three DAPI/GFP/HuCD staining channels in PTA (populations № 1 and 2), demonstrating colocalization of GFP/HuCD in neurons (white arrows in the inset, population № 1) and nuclei (red arrow in the inset, population № 1) or PTN neurons (yellow arrow). (H) PTN at higher magnification, DAPI stained nuclei (white arrows), GFP+ granules (yellow arrowheads). Laser scanning confocal microscopy. Scale bars: (A,C,E,G)—200 µm; (B,D,F,H)—50 µms. (I) ANOVA analysis results showing the comparative distribution of labeled cells and nuclei (M ± SD, where M is the mean and SD is the standard deviation) of the posterior tuberal area of the chum salmon. Significant intergroup differences were found between the groups of GCaMP6m-GFP+ and HuCD+, between GCaMP6m-GFP+ and GCaMP6m-GFP+/HuCD+ (# < 0.05) cells; and between the groups of HuCD+ and GCaMP6m-GFP+/HuCD+ (## < 0.01) cells (n = 5 in each group).
Figure 3
Figure 3
Z-stacks representing HuCD immunolabeling in the thalamus of juvenile chum salmon, O. keta, at 1 week after a single injection of recombinant AAV into the mesencephalic tegmentum area. (A) DAPI staining, the pictogram shows the thalamus area (in a red rectangle), rectangles outline clusters of small rounded nuclei, Dth—dorsal thalamus, Vth—ventral thalamus, DAPI-stained microvessel fragments (orange arrows), elongated nuclei (pink arrows), forming heterogeneous complexes with oval cells (outlined by red rectangle), as well as aggregations of nuclei (outlined by white dotted oval), forming parenchymal neurogenic niches. (B) DAPI-stained clusters of nuclei (outlined by white square) forming a complex of pretectal nuclei (PRT), ventral in the dotted square are thalamic zones of the reticular formation (rRF). (C) Expression of green fluorescent protein GFP in cells of the periventricular thalamus, an aggregation of GFP+ cells (red arrows) and granules (yellow arrowheads) in Dth (population № 1 outlined by yellow dashed rectangle), in Vth (population № 2 outlined by orange dotted rectangle), in PRT (population № 3 in the white rectangle), a weakly GFP-labeled cell (white arrow). (D) GFP expression in PRT cells (green arrows), rRF nuclei (red arrowheads), and granules (yellow arrowheads). (E) Immunofluorescence of the HuCD protein in neurons of the periventricular thalamus (green arrows), other designations are as in (C). (F) HuCD in PRT neurons (green arrows—intensely labeled, white—weakly labeled), in rRF (yellow arrows indicate weakly labeled differentiated neurons, yellow arrowheads indicate small neurons). (G) Superposition of three channels of DAPI/GFP/HuCD staining in cells (yellow arrows); Dth and Vth (populations № 1, 2), granules (yellow arrowheads), GFP–/HuCD+ neurons (red arrows), in PRT (population № 3) HuCD+/DAPI+/GFP– large neurons (green arrows) adjoined the population of GFP+/HuCD+ cells and nuclei on one side (in a white dotted rectangle), and on the other, to the vascular sinus (inset, outlined by white rectangle) with migration patterns (pink arrows). (H) In rRF, DAPI/GFP/HuCD colocalization patterns (outlined by white dotted square) in GFP+/HuCD+ cells (yellow arrows), nuclei (red arrows), and granules (yellow arrowheads). (I) Results of ANOVA analysis showing the comparative distribution of labeled cells and nuclei (M ± SD, where M is the mean and SD is the standard deviation) in the thalamus of juvenile chum salmon, O. keta. Significant intergroup differences (# < 0.05) were found between the groups of GCaMP6m-GFP+ and GCaMP6m-GFP+/HuCD+ cells and the groups of HuCD+ and GCaMP6m-GFP+/HuCD+ cells (n = 5 in each group).
Figure 4
Figure 4
Z-stacks representing HuCD immunolabeling in the postcommissural region of the basal mesencephalon of juvenile chum salmon, O. keta, at 1 week after a single injection of recombinant AAV into the mesencephalic tegmentum region. (A) DAPI staining, the pictogram shows the postcommissural region of the basal mesencephalon (outlined by the red rectangle), the dashed rectangle outlines the dorsal clusters, the nuclei are indicated by yellow arrows, PVZ—the periventricular zone, SVZ—the subventricular zone, PTN—the posterior tuberal nucleus, the MRF—mesencephalic reticular formation, III—hypothalamic ventricle. (B) Expression of GFP in cells (red arrows), dorso-medial posterior tuberal group (population № 1) (outlined by white dotted line), GFP+ granules (yellow arrowheads), perventricular aggregation (population № 2), an asterisk shows a GFP- nucleus aggregation, individual GFP+ cells in MRF, (population № 3), an aggregation of intensely fluorescent cells (population № 4) is outlined by red square, the inset shows a higher magnification. (C) Immunofluorescence of HuCD, designation as in B, neurons of populations № 2 and 3 are shown at higher magnification (inset). (D) Superposition of three DAPI/GFP/HuCD staining channels, showing areas of GFP/HuCD colocalization in neurons (yellow arrows), neurons of populations № 2, 3, and 4 are shown at higher magnification (inset). Laser scanning confocal microscopy. Scale bar: 200 µm. (E) Results of ANOVA analysis showing the comparative distribution of labeled cells and nuclei (M ± SD, where M is the mean and SD is the standard deviation) in the postcommissural area of the chum salmon. Significant intergroup differences (# < 0.05) were found between the groups of GCaMP6m-GFP+ and HuCD+ cells, GCaMP6m-GFP+ and GCaMP6m-GFP+/HuCD+ cells, and between the groups of HuCD+ and GCaMP6m-GFP+/HuCD+ cells (n = 5 in each group).
Figure 5
Figure 5
Z-stacks representing HuCD immunolabeling in the dorso-medial tegmentum of juvenile chum salmon, O. keta, 1 week after a single injection of recombinant AAV into the mesencephalic tegmentum area. (A) DAPI staining, the pictogram shows the area of the dorso-medial tegmentum (outlined by red rectangle, resting nuclei are indicated by orange arrows, migrating ones by pink arrows), clusters of nuclei are outlined by the white dashed oval, PZ is the parenchymal zone, and the other designations are as in Figure 4A. (B) GFP expression in cells (red arrows) of population № 1 (outlined by the yellow rectangle), population № 2 (outlined by the red rectangle, greater magnification in the inset), and population № 3 (outlined by the white dashed rectangle). (C) Immunofluorescence of HuCD (populations № 1–3) in small intensely labeled cells (green arrows) and large weakly labeled cells (white arrows). (D) Superposition of three DAPI/GFP/HuCD staining channels, showing areas of GFP/HuCD colocalization in neurons of populations № 2 and 3 (yellow arrows), cells without marker colocalization (green arrows), in populations № 3 large weakly HuCD-labeled cells (white arrows). Laser scanning confocal microscopy. Scale bar: 200 µm. (E) Results of ANOVA analysis showing the comparative distribution of labeled cells and nuclei (M ± SD, where M is the mean and SD is the standard deviation) of the dorso-medial tegmentum of chum salmon. Significant intergroup differences (# < 0.05) were found between the groups of GCaMP6m-GFP+ and HuCD+ cells and the groups of HuCD+ and GCaMP6m-GFP+/HuCD+ cells (n = 5 in each group).
Figure 6
Figure 6
Z-stacks representing HuCD immunolabeling in the dorso-lateral tegmentum of juvenile chum salmon, O. keta, at 1 week after a single injection of recombinant AAV into the mesencephalic tegmentum area. (A) DAPI staining, the pictogram shows the area of the dorso-lateral tegmentum (outlined by red rectangle), pink arrows indicate nuclei, orange arrows indicate the dilated blood sinus (Ves), the post-injection cavity (IL) is outlined by the white square. (B) Expression of GFP in cell populations: outlined by the red rectangle (population № 1, an enlarged fragment in the inset), single GFP+ cells (red arrows), GFP+ nuclei (white asterisk), GFP+ granules (yellow arrowhead), population № 2, on inset enlarged fragment (in the yellow dotted rectangle), population № 3 (in the yellow rectangle). (C) Immunofluorescence of HuCD in populations № 1–3 of neurons (green arrows, red arrows in the inset, other designations as in (B)). (D) Superposition of three DAPI/GFP HuCD staining channels, showing areas of GFP/HuCD colocalization in neurons (yellow arrows). Laser scanning confocal microscopy. Scale bar: 200 µm. (E) Results of ANOVA analysis showing the comparative distribution of labeled cells and nuclei (M ± SD, where M is the mean and SD is the standard deviation) of the dorso-medial tegmentum of chum salmon. Significant intergroup differences were found between the groups of GCaMP6m-GFP+ and HuCD+ cells, the GCaMP6m-GFP+ and GCaMP6m-GFP+/HuCD+ cells (# < 0.05), and between the groups of HuCD+ and GCaMP6m-GFP+/HuCD+ (## < 0.01) cells (n = 5 in each group).
Figure 7
Figure 7
Z-stacks representing HuCD immunolabeling in the Edinger–Westphal nucleus of juvenile chum salmon, O. keta, at 1 week after a single injection of recombinant AAV into the mesencephalic tegmentum area. (A) DAPI staining, the pictogram shows the area of the Edinger–Westphal nucleus (outlined by red rectangle) adjacent to the post-injection cavity (IL), single aggregations of nuclei/cells forming neurogenic niches (outlined by white oval) and numerous oval nuclei (orange arrows), or elongated shape (pink arrows). (B) At higher magnification, (C) GFP expression in cells (red arrows), aggregation of GFP+ granules (in the white oval), single GFP+ nuclei (white arrow). (D) At higher magnification, GFP+ granules (yellow arrowhead). (E) Immunofluorescence of the HuCD protein in EWN neurons, designations as in B. (F) EWN at higher magnification, HuCD+ neuron (red arrows). (G) Superposition of three DAPI/GFP/HuCD staining channels showing the areas of GFP/HuCD colocalization in neurons (yellow arrows), nucleus (white arrow), and GFP–/HuCD+ neurons (green arrow). (H) Colocalization in EWN at higher magnification. (I) Results of ANOVA analysis showing the comparative distribution of labeled cells and nuclei (M ± SD, where M is the mean and SD is the standard deviation) in the Edinger–Westphal nucleus of juvenile chum salmon. Significant intergroup differences (# < 0.05) were found between the groups of GCaMP6m-GFP+ and GCaMP6m-GFP+/HuCD+ cells and between groups of the HuCD+ and GCaMP6m-GFP+/HuCD+ cells (n = 5 in each group).
Figure 8
Figure 8
Z-stacks representing HuCD immunolabeling in the mesencephalic reticular formation of juvenile chum salmon, O. keta, at 1 week after a single injection of recombinant AAV into the mesencephalic tegmentum. (A) DAPI staining, a diagram of the AAV injection area (indicated by red zigzag) and the distribution of GFP expressing cells in the MRF is shown in the pictogram (outlined by the red square), labeled cell nuclei (orange arrows) and their clusters (outlined by the white oval), along the injection lumen (IL), invaginations of the parenchymal brain tissue were revealed, with heterogeneous clusters of stained nuclei (outlined by the white dotted rectangle), forming reactive neurogenic zones (dotted inset). (B) GFP expression in population № 1 (outlined by the red rectangle) containing GFP+ neurons (shown in the inset, red arrows), GFP+ nuclei (red arrowheads) and GFP+ granules (yellow arrowheads) and population № 2 (yellow rectangle, inset). (C) HuCD immunofluorescence in populations № 1 and 2, neurons are indicated by green arrows in the inset, yellow arrowheads indicate granules. (D) Superposition of three channels of DAPI/GFP/HuCD staining in population № 1 of neurons (yellow arrow) and GFP-/HuCD+ cells (green arrow), in population № 2 (inset in yellow rectangle), GFP–/HuCD+ granules (green arrowheads). (E) Results of ANOVA analysis showing the comparative distribution of labeled cells and nuclei (M ± SD, where M is the mean and SD is the standard deviation) in the MRF of juvenile chum salmon. Significant intergroup differences (# < 0.05) were found between the groups of GCaMP6m-GFP+ and GCaMP6m-GFP+/HuCD+ cells and the groups of HuCD+ and GCaMP6m-GFP+/HuCD+ cells (n = 5 in each group).
Figure 9
Figure 9
Comparative distribution (M ± SD) of GCaMP6m-GFP expressing cells and cells containing double GCaMP6m-GFP+/HuCD labeling in the mesencephalon and diencephalon of juvenile chum salmon, O. keta, at 1 week after a single injection of recombinant AAV mammalian hypocampus. Numerals along the X axis are as follows: (1) anterior hypothalamic ventricle; (2) posterior-tuberal area, 3—dorsal thalamus, 4—postcommissural area, 5—dorso-medial tegmentum, 6—dorso-lateral tegmentum, 7—Edinger–Westphal nucleus, 8—mesencephalic reticular formation.

Similar articles

Cited by

References

    1. Haery L., Deverman B.E., Matho K.S., Cetin A., Woodard K., Cepko C., Guerin K.I., Rego M.A., Ersing I., Bachle S.M., et al. Adeno-associated virus technologies and methods for targeted neuronal manipulation. Front. Neuroanat. 2019;13:93. doi: 10.3389/fnana.2019.00093. - DOI - PMC - PubMed
    1. Muramatsu S., Fujimoto K., Kato S., Mizukami H., Asari S., Ikeguchi K. A phase I study of aromatic L-amino acid decarboxylase gene therapy for Parkinson’s disease. Mol. Ther. 2010;18:1731–1735. doi: 10.1038/mt.2010.135. - DOI - PMC - PubMed
    1. Gessler D.J., Tai P.W.L., Li J., Gao G. Intravenous infusion of AAV for widespread gene delivery to the nervous system. Methods Mol. Biol. 2019;1950:143–163. doi: 10.1007/978-1-4939-9139-6_8. - DOI - PMC - PubMed
    1. Bence G., Zachary F., Matheus H., Crommentuijn W., Dakai M., Maguire C.A. Naturally enveloped AAV vectors for shielding neutralizing antibodies and robust gene delivery in vivo. Biomaterials. 2014;35:7598–7609. - PMC - PubMed
    1. Shinohara Y., Konno A., Nitta K., Matsuzaki Y., Yasui H., Suwa J., Hiromura K., Hirai H. Effects of neutralizing antibody production on AAV-PHP.B-mediated ransduction of the mouse central nervous system. Mol. Neurobiol. 2019;56:4203–4214. doi: 10.1007/s12035-018-1366-4. - DOI - PubMed

LinkOut - more resources