Comparative Study
. 2021 May 26;22(11):5665.
doi: 10.3390/ijms22115665.

Proteomic Comparison of Bone Marrow Derived Osteoblasts and Mesenchymal Stem Cells

Affiliations
Comparative Study

Proteomic Comparison of Bone Marrow Derived Osteoblasts and Mesenchymal Stem Cells

Elise Aasebø et al. Int J Mol Sci. .

Abstract

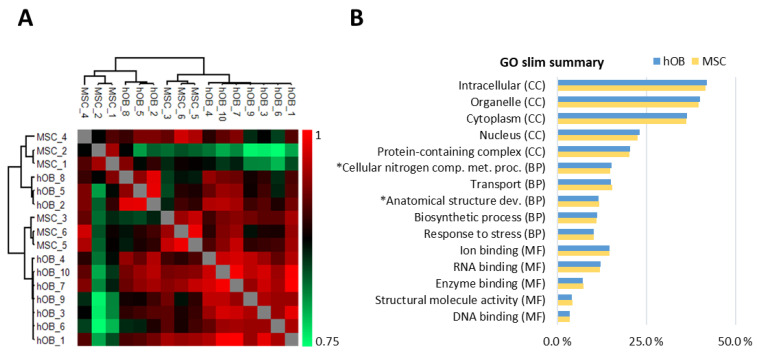
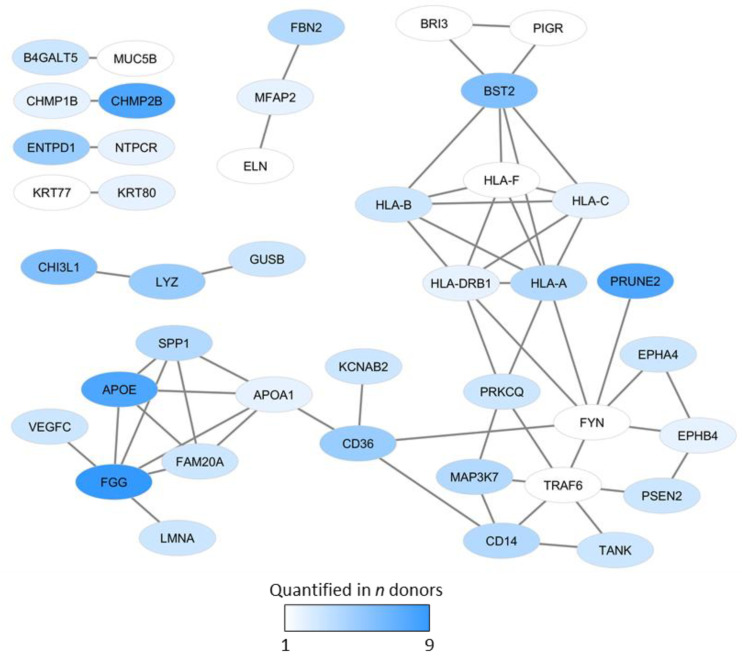
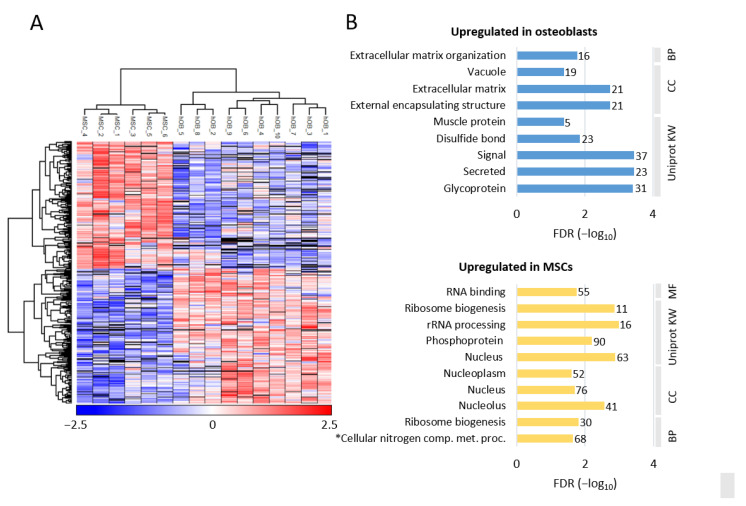
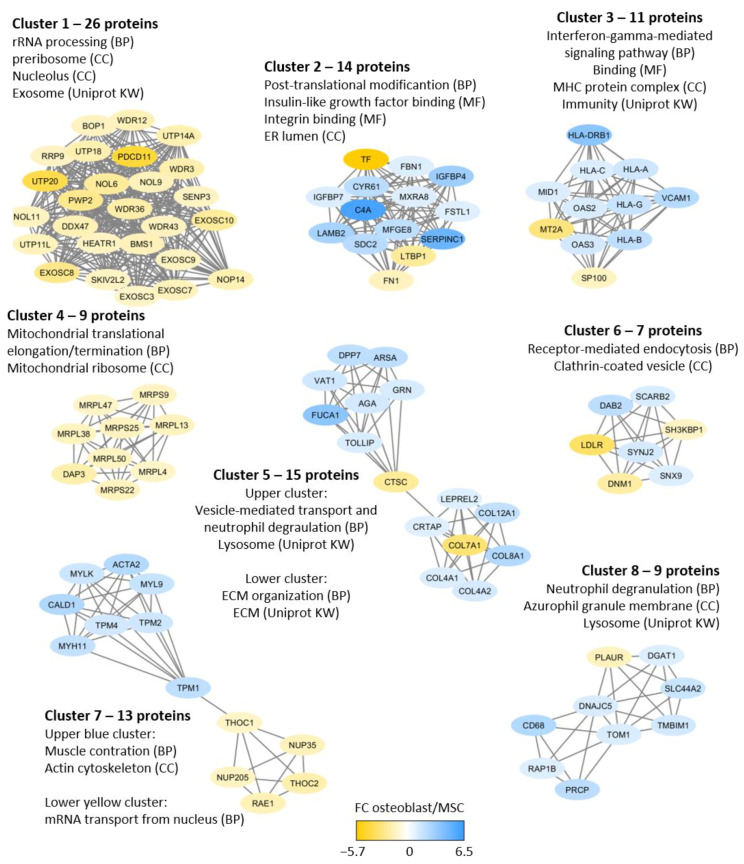
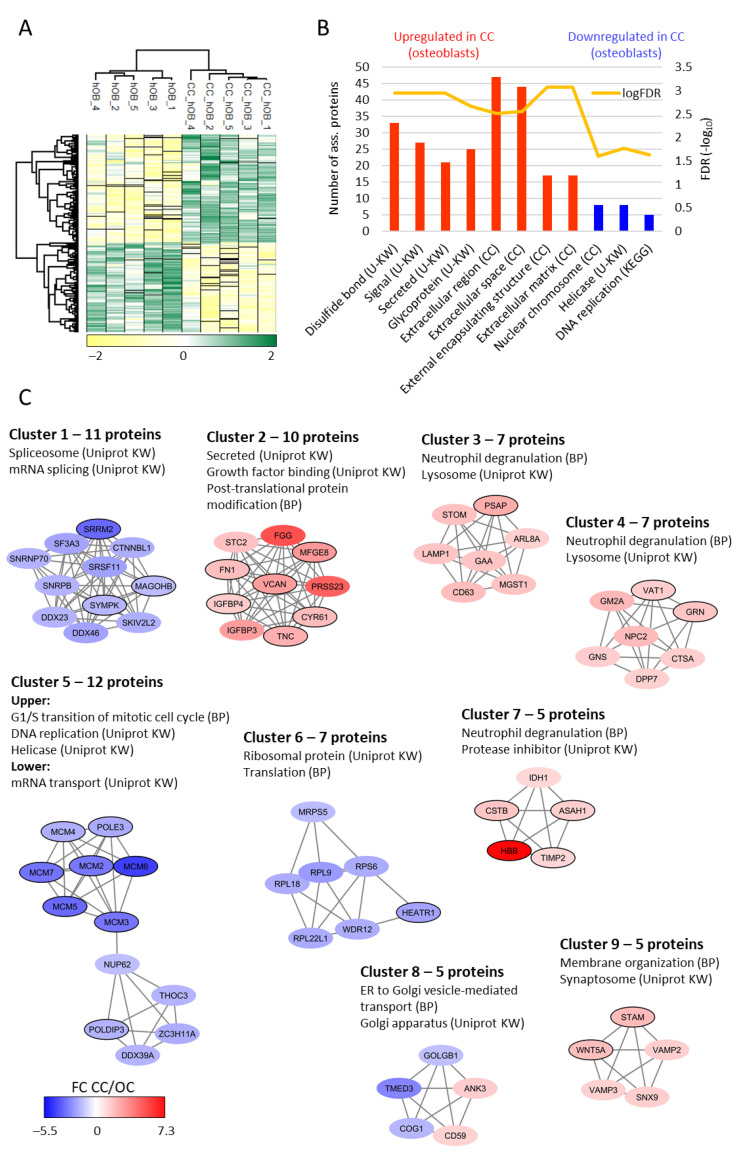
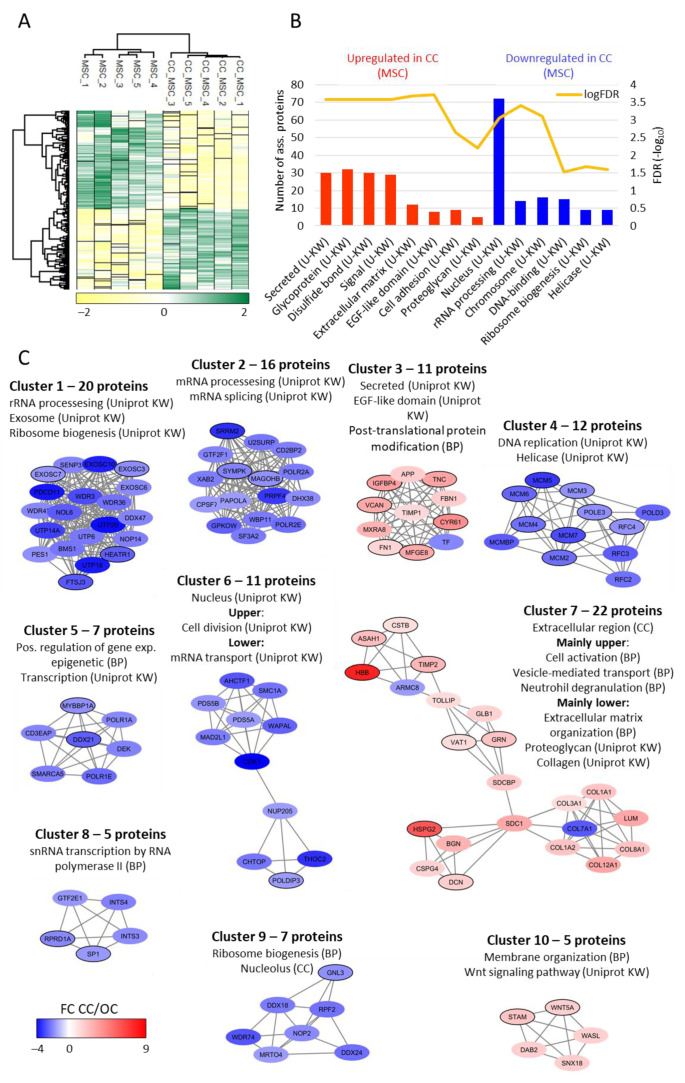
Mesenchymal stem cells (MSCs) can differentiate into osteoblasts, and therapeutic targeting of these cells is considered both for malignant and non-malignant diseases. We analyzed global proteomic profiles for osteoblasts derived from ten and MSCs from six healthy individuals, and we quantified 5465 proteins for the osteoblasts and 5420 proteins for the MSCs. There was a large overlap in the profiles for the two cell types; 156 proteins were quantified only in osteoblasts and 111 proteins only for the MSCs. The osteoblast-specific proteins included several extracellular matrix proteins and a network including 27 proteins that influence intracellular signaling (Wnt/Notch/Bone morphogenic protein pathways) and bone mineralization. The osteoblasts and MSCs showed only minor age- and sex-dependent proteomic differences. Finally, the osteoblast and MSC proteomic profiles were altered by ex vivo culture in serum-free media. We conclude that although the proteomic profiles of osteoblasts and MSCs show many similarities, we identified several osteoblast-specific extracellular matrix proteins and an osteoblast-specific intracellular signaling network. Therapeutic targeting of these proteins will possibly have minor effects on MSCs. Furthermore, the use of ex vivo cultured osteoblasts/MSCs in clinical medicine will require careful standardization of the ex vivo handling of the cells.

Keywords: bone marrow; ex vivo handling; in vitro culture; mesenchymal stem cell; osteoblast; proteome.


Conflict of interest statement

The authors declare no conflict of interest. The funders had no role in the design of the study; in the collection, analyses, or interpretation of data; in the writing of the manuscript, or in the decision to publish the results.

Figures

Figure 1
Figure 1
Assessment of the global MSC and osteoblast proteomes. (A) Protein intensity correlation analysis based on all samples. The analysis included proteins that showed detectable levels for at least five osteoblast and three MSC donors (Pearson R > 0.76). (B) GO slim summary based on the global proteomes of osteoblasts and MSCs. The data were obtained from a GO tool, and the top five annotated GO terms reflecting cellular compartments (CC), biological processes (BP) and molecular functions (MF) are presented. * The full GO terms are “cellular nitrogen compound metabolic process” and “anatomical structure development”.
Figure 2
Figure 2
Osteoblast-specific protein interaction networks. The figure presents networks from the String database based on proteins only reaching quantifiable levels in osteoblasts; 41 of the 156 osteoblast-specific proteins were connected in the various networks. The color key gradient from white to blue indicates the number of donors with quantifiable levels for each of the proteins (e.g., only one donor white color, at least nine donors the darkest blue).
Figure 3
Figure 3
(page 7). Differential protein expression in osteoblasts and MSCs. (A) The figure shows the unsupervised hierarchical clustering analysis based on the 447 significantly abundant proteins when comparing cells from 10 osteoblast and six MSC donors. A total of 4747 proteins showed quantitative values (i.e., LFQ protein intensity) for at least three donors for each of the two cell types, and the unsupervised hierarchical clustering analysis was based on those 447 proteins that showed significant differences in fold change (FC) when comparing osteoblasts and MSCs; 231 of these proteins were increased in osteoblasts and 216 were increased in MSCs. The clustering analysis showed a clear separation between the groups, i.e., clearly separated the two cell types into two groups. The color key indicates the log2-transformed and Z-scored protein intensities. (B) Gene ontology enrichment of proteins with higher abundance in osteoblasts and MSCs. The analysis was performed in a GO tool. The bar plots show the the FDR (−log10) of enriched GO terms (i.e., biological processes, BP; cellular compartments, CC; molecular function, MF; and Uniprot Keyword, KW), and the number of proteins associated with each individual term is indicated to the left of the corresponding bar. * The full name of the term (lowest bar, Upregulated in MSCs) is Cellular nitrogen compound metabolic process.
Figure 4
Figure 4
Protein interaction analysis based on 447 differentially regulated proteins. A total of 4747 proteins showed quantitative values (i.e., LFQ protein intensity) for at least three donors for each of the two cell types, and the interaction analysis was based on those 447 proteins that showed significant differences in fold change (FC) when comparing osteoblasts and MSCs; 231 of these proteins were increased in osteoblasts and 216 were increased in MSCs. The color key presents the protein fold change (FC) between osteoblasts and MSCs (based on normalized, log2-transformed and Z-scored protein intensities); increased protein levels in osteoblasts are marked with blue whereas increased levels in MSCs are marked with yellow. The figure presents the eight identified networks/clusters with high connectivity found by applying the MCODE application on the String network in Cytoscape. The GO/Uniprot Keyword terms (i.e., biological processes, BP; cellular compartments, CC; molecular function, MF; and Uniprot Keyword, KW) were obtained from String analyses.
Figure 5
Figure 5
Comparison of osteoblast proteomic profiles before (i.e., original cells, OC) and after culture (referred to as cultured cells, CC) in suboptimal IMDM medium. A total of 286 proteins differed significantly between the two groups. (A) Hierarchical clustering based on the 286 proteins with significantly different abundance clearly separated the samples into two groups. The color key gradient indicates the normalized and log2-transformed LFQ protein intensity (Z-scored). (B) GO enrichment analysis of the 156 proteins with increased abundance after cell culture (red bars) and the 130 proteins with decreased abundance after cell culture (blue bars). The bar height represents the number of proteins associated to a given term (right y-axis) and the FDR (−log10) of each GO term is represented by the yellow line (left y-axis). (C) Protein–protein interaction network analysis was based on the 286 significantly altered proteins, generated in String and further processes with Cytoscape and MCODE to identify protein clusters with high connectivity. The color coding indicates the fold change (FC) after cell culture (CC) in suboptimal medium relative to original cells (OC), i.e., red protein nodes indicate increased abundance in suboptimal medium while blue protein nodes indicate decreased abundance in suboptimal medium. Proteins significantly regulated in both osteoblasts and MSCs are indicated by a black border surrounding the protein node (see Figure 6). Other abbreviations used in the figure: BP, biological process; CC, cellular compartment; U-KW, Uniprot key word; KEGG, Kyoto Encyclopedia of Genes and Genomes.
Figure 6
Figure 6
A comparison of MSCs proteomic profiles before and following in vitro culture in suboptimal serum-free IMDM medium; the suboptimal in vitro microenvironment causing increased levels especially of several proteins involved in extracellular matrix, cell adhesion, and EGF-like domain after cell culture in suboptimal medium. A total of 4192 proteins had paired quantitative values for at least three MSC donors, and 357 of these proteins had significantly different abundance when comparing original optimal preculture (i.e., original cells, OC) and suboptimal IMDM-cultured cells (i.e., cultured cells, CC). (A) Unsupervised hierarchical clustering analysis based on the 357 proteins with significantly different abundance when comparing MSCs cells before and after cell clearly separated the samples into two groups. The color key gradient indicates the normalized and log2-transformed LFQ protein intensity (Z-scored). (B) GO enrichment analysis of the 162 proteins with increased abundance after cell culture (red bars) and the 195 proteins with decreased abundance after cell culture (blue bars). The Uniprot Keyword (KW) terms are presented. The bar height represents the number of proteins associated to a given term (right y-axis) and the FDR (−log10) of each GO term is represented by the yellow line (left y-axis). (C) Protein–protein interaction network analysis was based on the 357 significantly altered proteins, generated in String and further processes with Cytoscape and MCODE to find protein clusters with high connectivity. The color coding indicates the fold change (FC) after cell culture (CC) in suboptimal medium relative to original cells (OC); i.e., red protein nodes indicate increased abundance in suboptimal medium while blue protein nodes indicate decreased abundance in suboptimal medium. Proteins significantly regulated in both osteoblasts and MSCs (see Figure 5) are indicated by a black border surrounding the protein node. Abbreviations used in the figure: BP, biological process; CC, cellular compartment; Uniprot KW, Uniprot keyword.

Similar articles

Cited by

References

    1. Domingues M.J., Cao H., Heazlewood S.Y., Cao B., Nilsson S.K. Niche Extracellular Matrix Components and Their Influence on HSC. J. Cell. Biochem. 2017;118:1984–1993. doi: 10.1002/jcb.25905. - DOI - PubMed
    1. Sangaletti S., Chiodoni C., Tripodo C., Colombo M.P. Common extracellular matrix regulation of myeloid cell activity in the bone marrow and tumor microenvironments. Cancer Immunol. Immunother. 2017;66:1059–1067. doi: 10.1007/s00262-017-2014-y. - DOI - PMC - PubMed
    1. Klamer S., Voermans C. The role of novel and known extracellular matrix and adhesion molecules in the homeostatic and regenerative bone marrow microenvironment. Cell Adh. Migr. 2014;8:563–577. doi: 10.4161/19336918.2014.968501. - DOI - PMC - PubMed
    1. Vedi A., Santoro A., Dunant C.F., Dick J.E., Laurenti E. Molecular landscapes of human hematopoietic stem cells in health and leukemia. Ann. N. Y. Acad. Sci. 2016;1370:5–14. doi: 10.1111/nyas.12981. - DOI - PubMed
    1. Yu V.W., Scadden D.T. Hematopoietic Stem Cell and Its Bone Marrow Niche. Curr. Top. Dev. Biol. 2016;118:21–44. - PMC - PubMed

Publication types

LinkOut - more resources