A Comparative Analysis of In Vitro Toxicity of Synthetic Zeolites on IMR-90 Human Lung Fibroblast Cells
- PMID: 34073510
- PMCID: PMC8198335
- DOI: 10.3390/molecules26113194
A Comparative Analysis of In Vitro Toxicity of Synthetic Zeolites on IMR-90 Human Lung Fibroblast Cells
Abstract
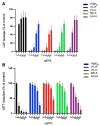
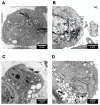
Broad industrial application of zeolites increases the opportunity of inhalation. However, the potential impact of different types and compositions of zeolite on cytotoxicity is still unknown. Four types of synthetic zeolites have been prepared for assessing the effect on lung fibroblast: two zeolite L (LTL-R and LTL-D), ZSM-5 (MFI-S), and faujasite (FAU-S). The cytotoxicity of zeolites on human lung fibroblast (IMR-90) was assessed using WST1 cell proliferation assay, mitochondrial function, membrane leakage of lactate dehydrogenase, reduced glutathione levels, and mitochondrial membrane potential were assessed under control. Intracellular changes were examined using transmission electron microscopy (TEM). Toxicity-related gene expressions were evaluated by PCR array. The result showed significantly higher toxicity in IMR-90 cells with FAU-S than LTL-R, LTL-D and MFI-S exposure. TEM showed FAU-S, spheroidal zeolite with a low Si/Al ratio, was readily internalized forming numerous phagosomes in IMR-90 cells, while the largest and disc-shaped zeolites showed the lowest toxicity and were located in submembranous phagosomes in IMR-90 cells. Differential expression of TNF related genes was detected using PCR arrays and confirmed using qRT-PCR analysis of selected genes. Collectively, the exposure of different zeolites shows different toxicity on IMR-90 cells.
Keywords: IMR-90; cytotoxicity; fibroblast; glutathione; lung; zeolite.
Conflict of interest statement
The authors declare no conflict of interest.
Figures


Similar articles
-
Protective effect of lipoic acid against acrolein-induced cytotoxicity in IMR-90 human fibroblasts.J Nutr Sci Vitaminol (Tokyo). 2009 Apr;55(2):126-30. doi: 10.3177/jnsv.55.126. J Nutr Sci Vitaminol (Tokyo). 2009. PMID: 19436138
-
Reactive oxygen species mediated DNA damage in human lung alveolar epithelial (A549) cells from exposure to non-cytotoxic MFI-type zeolite nanoparticles.Toxicol Lett. 2012 Dec 17;215(3):151-60. doi: 10.1016/j.toxlet.2012.10.007. Epub 2012 Oct 24. Toxicol Lett. 2012. PMID: 23103338
-
Study on the Synthesis of Chabazite Zeolites via Interzeolite Conversion of Faujasites.J Anal Methods Chem. 2021 Mar 29;2021:5554568. doi: 10.1155/2021/5554568. eCollection 2021. J Anal Methods Chem. 2021. PMID: 33859863 Free PMC article.
-
Ruthenium tris(2,2'-bipyridyl) complex encapsulated in nanosized faujasite zeolite as intracellular localization tracer.J Colloid Interface Sci. 2021 Jan 1;581(Pt B):919-927. doi: 10.1016/j.jcis.2020.08.117. Epub 2020 Sep 9. J Colloid Interface Sci. 2021. PMID: 32956911
-
Removal of free fatty acid in waste frying oil by esterification with methanol on zeolite catalysts.Bioresour Technol. 2008 Nov;99(16):7438-43. doi: 10.1016/j.biortech.2008.02.031. Epub 2008 Apr 1. Bioresour Technol. 2008. PMID: 18387298
Cited by
-
Pneumolysin-responsive liposomal platform for selective treatment of Streptococcus pneumoniae.Drug Deliv Transl Res. 2025 May;15(5):1739-1754. doi: 10.1007/s13346-024-01708-5. Epub 2024 Sep 16. Drug Deliv Transl Res. 2025. PMID: 39285123
-
Can Zeolite-Supporting Acridines Boost Their Anticancer Performance?J Funct Biomater. 2023 Mar 22;14(3):173. doi: 10.3390/jfb14030173. J Funct Biomater. 2023. PMID: 36976097 Free PMC article.
References
-
- Laurent S., Ng E.P., Thirifays C., Lakiss L., Goupil G.M., Mintova S., Burtea C., Oveisi E., Hébert C., De Vries M., et al. Corona protein composition and cytotoxicity evaluation of ultra-small zeolites synthesized from template free precursor suspensions. Toxicol. Res. 2013;2:270–279. doi: 10.1039/c3tx50023c. - DOI
Publication types
MeSH terms
Substances
Grants and funding
LinkOut - more resources
Full Text Sources

