

The C0-C1f Region of Cardiac Myosin Binding Protein-C Induces Pro-Inflammatory Responses in Fibroblasts via TLR4 Signaling
- PMID: 34073556
- PMCID: PMC8230336
- DOI: 10.3390/cells10061326
The C0-C1f Region of Cardiac Myosin Binding Protein-C Induces Pro-Inflammatory Responses in Fibroblasts via TLR4 Signaling
Abstract
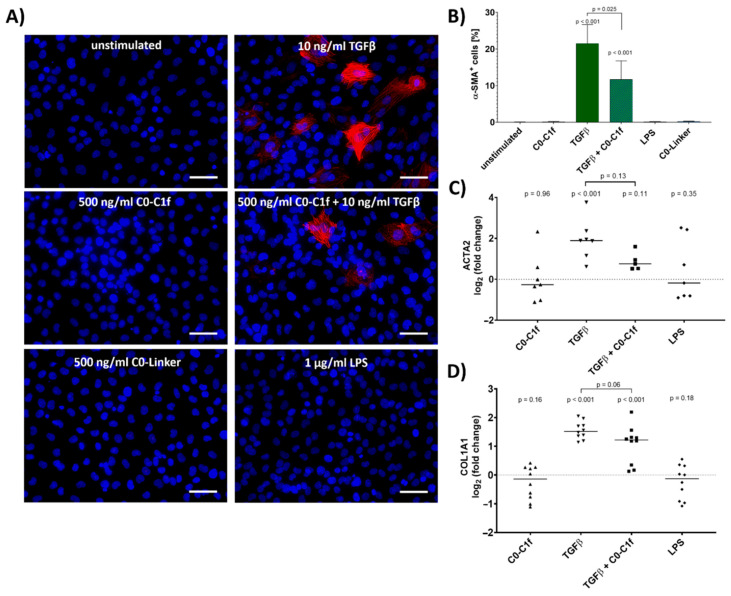
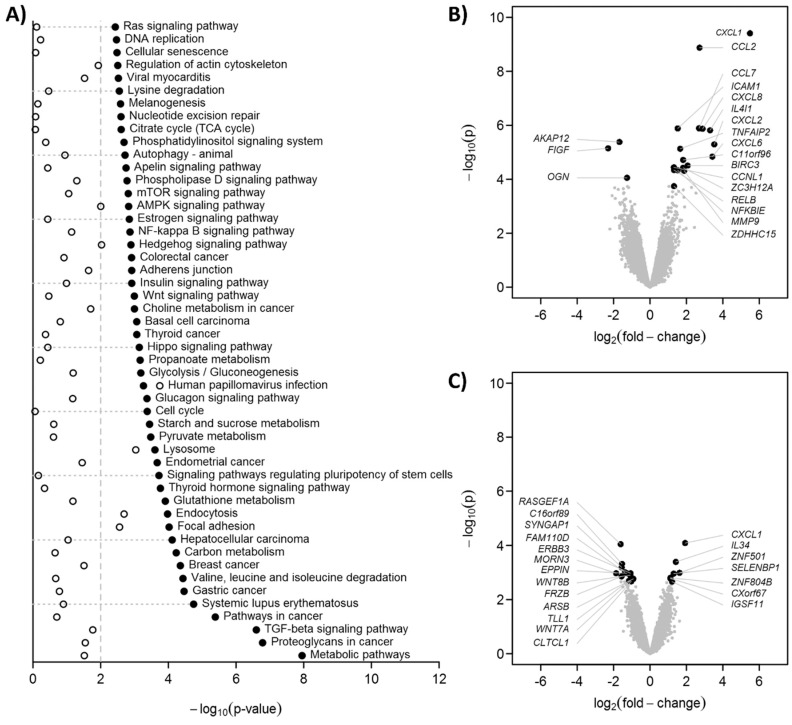
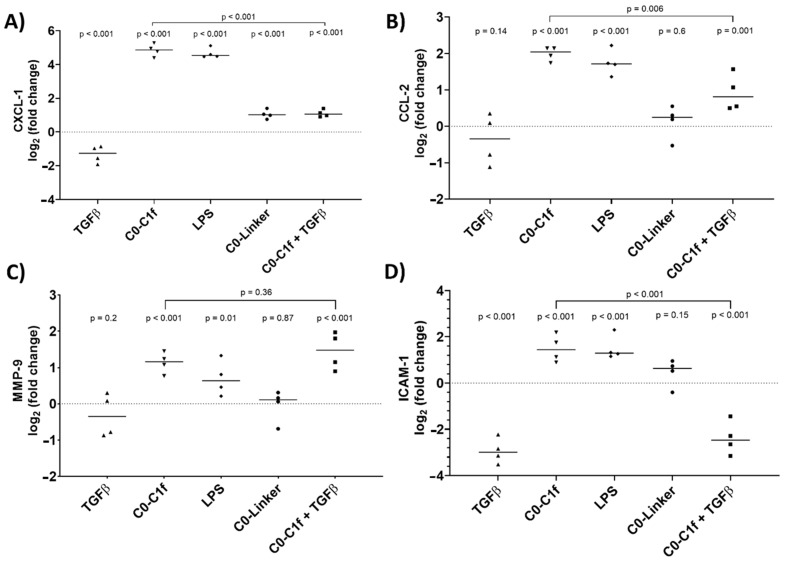
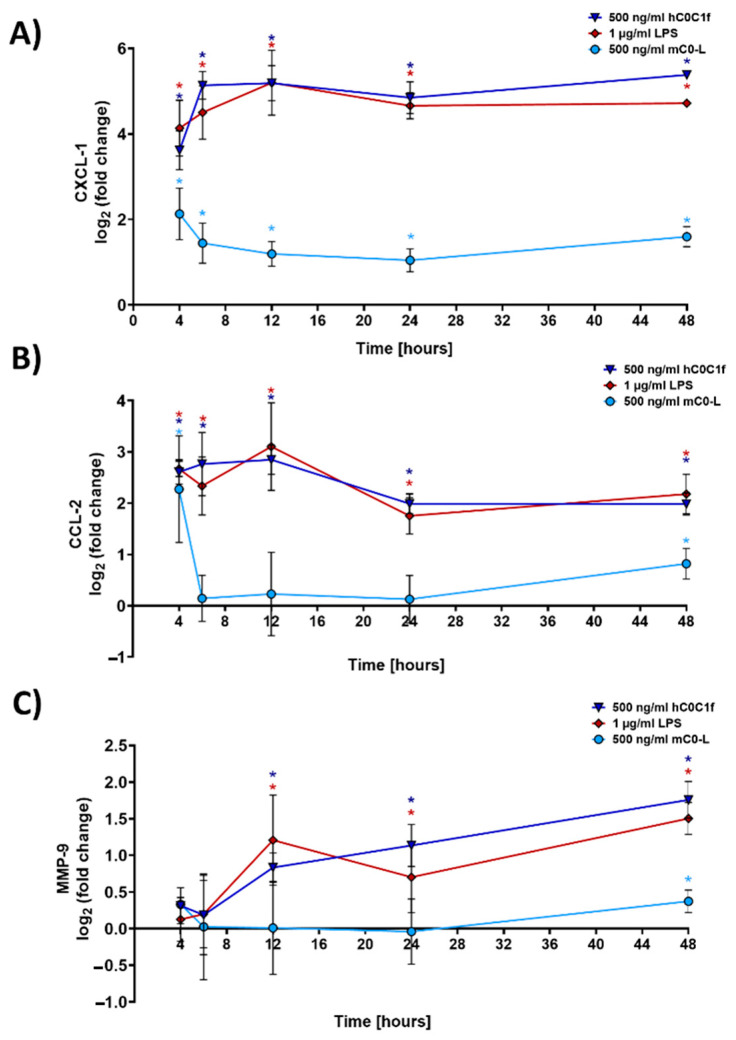
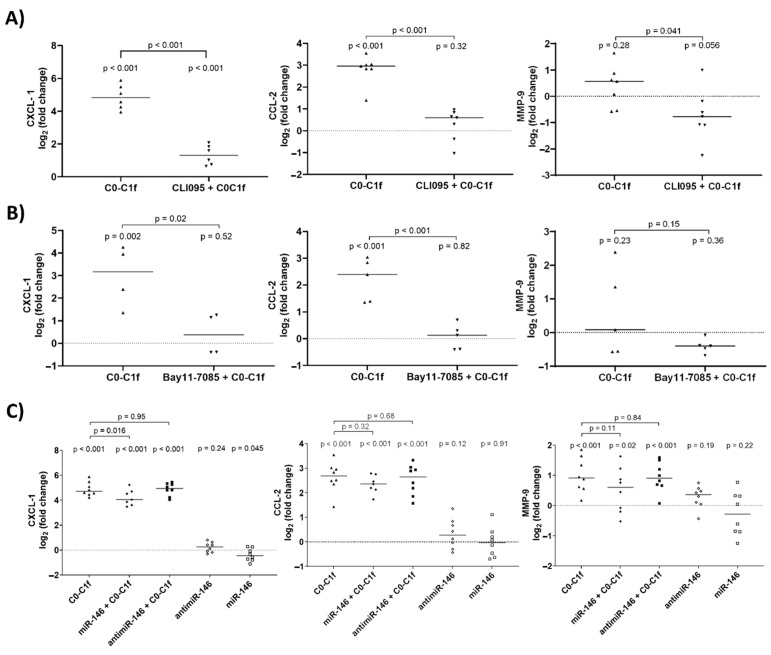
Myocardial injury is associated with inflammation and fibrosis. Cardiac myosin-binding protein-C (cMyBP-C) is cleaved by µ-calpain upon myocardial injury, releasing C0-C1f, an N-terminal peptide of cMyBP-C. Previously, we reported that the presence of C0-C1f is pathogenic within cardiac tissue and is able to activate macrophages. Fibroblasts also play a crucial role in cardiac remodeling arising from ischemic events, as they contribute to both inflammation and scar formation. To understand whether C0-C1f directly modulates fibroblast phenotype, we analyzed the impact of C0-C1f on a human fibroblast cell line in vitro by performing mRNA microarray screening, immunofluorescence staining, and quantitative real-time PCR. The underlying signaling pathways were investigated by KEGG analysis and determined more precisely by targeted inhibition of the potential signaling cascades in vitro. C0-C1f induced pro-inflammatory responses that might delay TGFβ-mediated myofibroblast conversion. TGFβ also counteracted C0-C1f-mediated fibroblast activation. Inhibition of TLR4 or NFκB as well as the delivery of miR-146 significantly reduced C0-C1f-mediated effects. In conclusion, C0-C1f induces inflammatory responses in human fibroblasts that are mediated via TRL4 signaling, which is decreased in the presence of TGFβ. Specific targeting of TLR4 signaling could be an innovative strategy to modulate C0-C1f-mediated inflammation.
Keywords: C0-C1f; MYBPC3; cMyBP-C; fibroblasts; inflammation; miRNA-146.
Conflict of interest statement
Sadayappan provided consulting and collaborative research studies to the Leducq Foundation, Red Saree Inc., Greater Cincinnati Tamil Sangam, AstraZeneca, MyoKardia, Merck and Amgen, but such work is unrelated to the content of this manuscript. No other disclosures are reported. Truschel is an employee of InSCREENeX GmbH, which commercializes the immortalized cell line (huFib) described in this work.
Figures
Similar articles
-
Myocardial infarction-induced N-terminal fragment of cardiac myosin-binding protein C (cMyBP-C) impairs myofilament function in human myocardium.J Biol Chem. 2014 Mar 28;289(13):8818-27. doi: 10.1074/jbc.M113.541128. Epub 2014 Feb 7. J Biol Chem. 2014. PMID: 24509847 Free PMC article.
-
Amino terminus of cardiac myosin binding protein-C regulates cardiac contractility.J Mol Cell Cardiol. 2021 Jul;156:33-44. doi: 10.1016/j.yjmcc.2021.03.009. Epub 2021 Mar 26. J Mol Cell Cardiol. 2021. PMID: 33781820 Free PMC article.
-
Toll-like receptor 4 contributes to a myofibroblast phenotype in cardiac fibroblasts and is associated with autophagy after myocardial infarction in a mouse model.Atherosclerosis. 2018 Dec;279:23-31. doi: 10.1016/j.atherosclerosis.2018.10.018. Epub 2018 Oct 19. Atherosclerosis. 2018. PMID: 30399463
-
Species-specific differences in the Pro-Ala rich region of cardiac myosin binding protein-C.J Muscle Res Cell Motil. 2009 Dec;30(7-8):303-6. doi: 10.1007/s10974-010-9207-8. Epub 2010 Mar 9. J Muscle Res Cell Motil. 2009. PMID: 20217194 Free PMC article. Review.
-
The extracellular matrix modulates fibroblast phenotype and function in the infarcted myocardium.J Cardiovasc Transl Res. 2012 Dec;5(6):837-47. doi: 10.1007/s12265-012-9406-3. Epub 2012 Sep 7. J Cardiovasc Transl Res. 2012. PMID: 22956156 Free PMC article. Review.
Cited by
-
South Asian-Specific MYBPC3 Δ25bp Deletion Carriers Display Hypercontraction and Impaired Diastolic Function Under Exercise Stress.Front Cardiovasc Med. 2021 Dec 23;8:766339. doi: 10.3389/fcvm.2021.766339. eCollection 2021. Front Cardiovasc Med. 2021. PMID: 35004883 Free PMC article.
-
Molecular Dynamics Study of Citrullinated Proteins Associated with the Development of Rheumatoid Arthritis.Proteomes. 2022 Feb 11;10(1):8. doi: 10.3390/proteomes10010008. Proteomes. 2022. PMID: 35225987 Free PMC article.
-
Noncoding RNAs: Master Regulator of Fibroblast to Myofibroblast Transition in Fibrosis.Int J Mol Sci. 2023 Jan 16;24(2):1801. doi: 10.3390/ijms24021801. Int J Mol Sci. 2023. PMID: 36675315 Free PMC article. Review.
-
Cardiac myosin binding protein C correlate with cardiac troponin I during an exercise training program in patients with HFrEF.ESC Heart Fail. 2025 Jun;12(3):2382-2386. doi: 10.1002/ehf2.15222. Epub 2025 Jan 23. ESC Heart Fail. 2025. PMID: 39846345 Free PMC article. Clinical Trial.
References
-
- Mouton A.J., DeLeon-Pennell K.Y., Rivera Gonzalez O.J., Flynn E.R., Freeman T.C., Saucerman J.J., Garrett M.R., Ma Y., Harmancey R., Lindsey M.L. Mapping macrophage polarization over the myocardial infarction time continuum. Basic Res. Cardiol. 2018;113:26. doi: 10.1007/s00395-018-0686-x. - DOI - PMC - PubMed
Publication types
MeSH terms
Substances
Grants and funding
LinkOut - more resources
Full Text Sources
