

Strong and Bitter Vegetables from Traditional Cultivars and Cropping Methods Improve the Health Status of Type 2 Diabetics: A Randomized Control Trial
- PMID: 34073610
- PMCID: PMC8227621
- DOI: 10.3390/nu13061813
Strong and Bitter Vegetables from Traditional Cultivars and Cropping Methods Improve the Health Status of Type 2 Diabetics: A Randomized Control Trial
Abstract
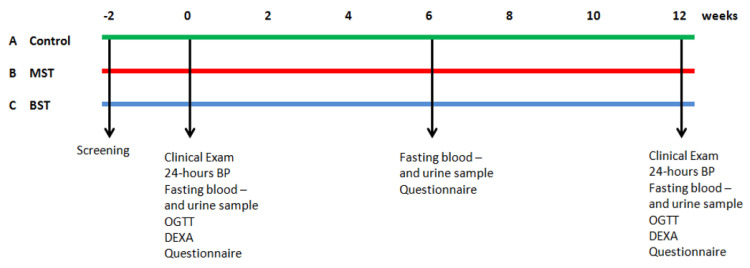
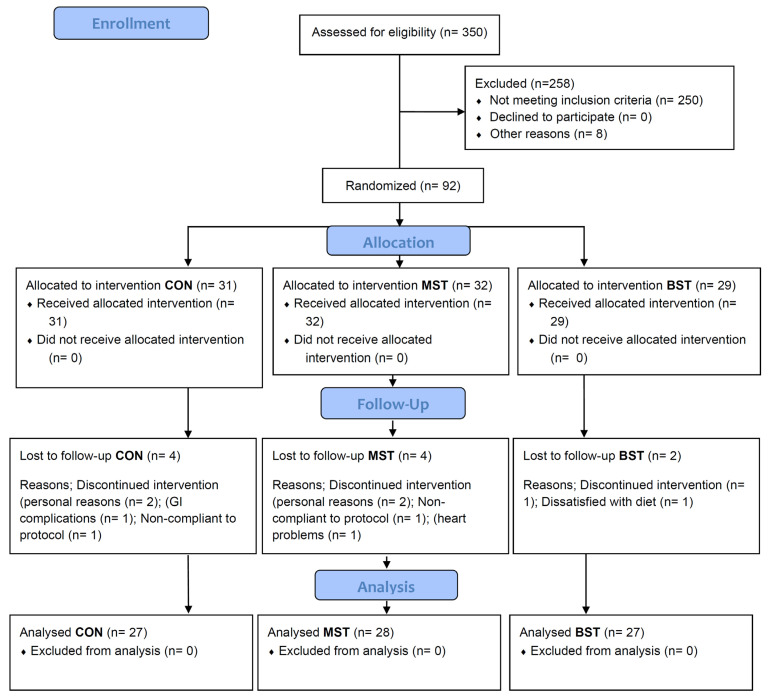
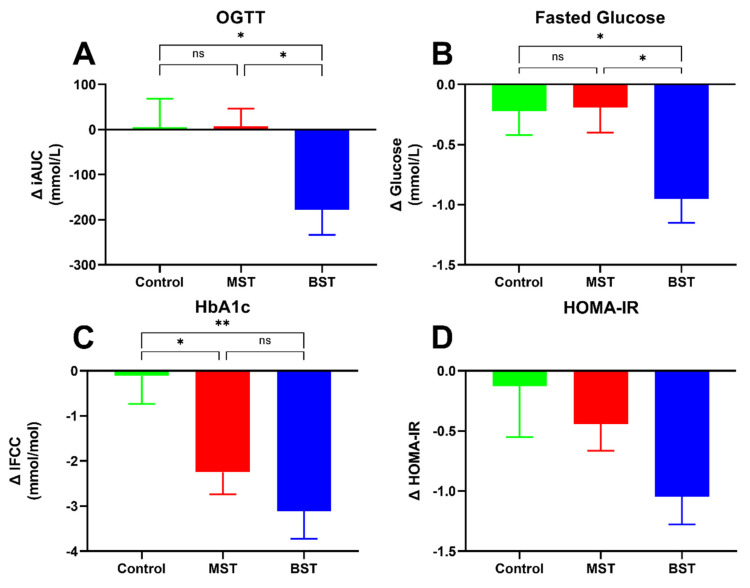
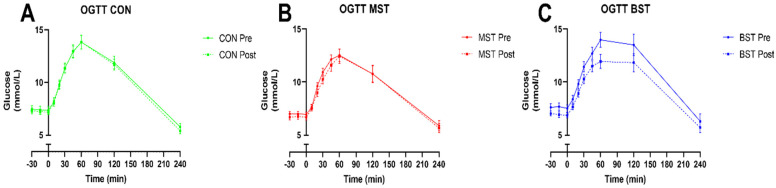
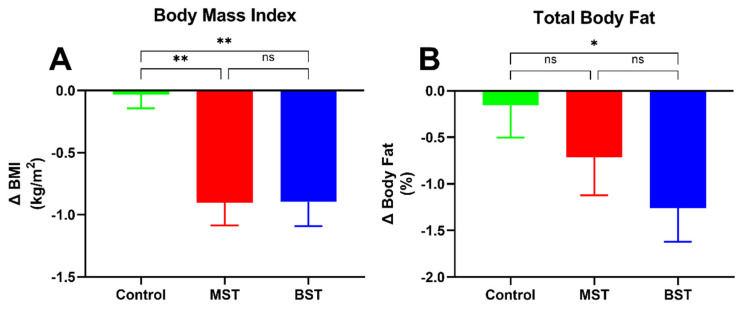
Vegetables rich in bitter-tasting phytochemicals may exert enhanced beneficial effects against key factors associated with type two diabetes (T2D). This study investigates whether selected cultivars of bitter and strong-tasting (BST) Brassica and root vegetables exert greater health benefits on T2D patients compared to equivalent modern mild and sweet tasting (MST) vegetables. A 12-week randomized, controlled, parallel intervention study involved 92 T2D patients, who were allocated three different diets: (1) 500 g daily of bitter and strong-tasting (BST) vegetables; (2) 500 g daily of mild and sweet-tasting (MST) vegetables; (3) 120 g daily MST normal diet (control). Both vegetable diets contained root vegetables and cabbages selected based on sensory differences and content of phytochemicals. Prior to and after the study, all participants underwent an oral glucose tolerance test (OGTT), 24 h blood pressure measurements, DEXA scans, and fasted blood samples. Both diets high in vegetables significantly reduced the participants' BMI, total body fat mass, and HbA1c levels compared to control, but in the BST group, significant differences were also found regarding incremental area under the curve glucose 240 min (OGTT) and fasting glucose levels. A high daily intake of root vegetables and cabbages showed significant health improvements in both vegetable groups. BST vegetables had the greatest impact on insulin sensitivity, body fat mass, and blood pressure compared to control; moreover, they further improved glycemic control compared to MST vegetables.
Keywords: cultivars; glucose tolerance; phytochemicals and sensory analysis; type 2 diabetes mellitus; vegetables.
Conflict of interest statement
The authors declare no conflict of interest. The funders had no role in the design of the study; in the collection, analyses, or interpretation of data; in the writing of the manuscript, or in the decision to publish the results.
Figures
Similar articles
-
Beneficial Effects of a Freeze-Dried Kale Bar on Type 2 Diabetes Patients: A Randomized, Double-Blinded, Placebo-Controlled Clinical Trial.Nutrients. 2024 Oct 26;16(21):3641. doi: 10.3390/nu16213641. Nutrients. 2024. PMID: 39519473 Free PMC article. Clinical Trial.
-
Effects of exercise training alone vs a combined exercise and nutritional lifestyle intervention on glucose homeostasis in prediabetic individuals: a randomised controlled trial.Diabetologia. 2016 Oct;59(10):2088-98. doi: 10.1007/s00125-016-4051-z. Epub 2016 Jul 15. Diabetologia. 2016. PMID: 27421729 Free PMC article. Clinical Trial.
-
High Intensity Interval Training Improves Glycaemic Control and Pancreatic β Cell Function of Type 2 Diabetes Patients.PLoS One. 2015 Aug 10;10(8):e0133286. doi: 10.1371/journal.pone.0133286. eCollection 2015. PLoS One. 2015. PMID: 26258597 Free PMC article. Clinical Trial.
-
Bitter taste of Brassica vegetables: The role of genetic factors, receptors, isothiocyanates, glucosinolates, and flavor context.Crit Rev Food Sci Nutr. 2018;58(18):3130-3140. doi: 10.1080/10408398.2017.1353478. Epub 2017 Sep 6. Crit Rev Food Sci Nutr. 2018. PMID: 28718657 Review.
-
Is Bitterness Only a Taste? The Expanding Area of Health Benefits of Brassica Vegetables and Potential for Bitter Taste Receptors to Support Health Benefits.Nutrients. 2022 Mar 30;14(7):1434. doi: 10.3390/nu14071434. Nutrients. 2022. PMID: 35406047 Free PMC article. Review.
Cited by
-
Unveiling the Nutritional Veil of Sulforaphane: With a Major Focus on Glucose Homeostasis Modulation.Nutrients. 2024 Jun 14;16(12):1877. doi: 10.3390/nu16121877. Nutrients. 2024. PMID: 38931232 Free PMC article. Review.
-
Protective role of sulforaphane in lipid metabolism-related diseases.Mol Biol Rep. 2025 Feb 17;52(1):241. doi: 10.1007/s11033-025-10358-w. Mol Biol Rep. 2025. PMID: 39961997 Review.
-
Cruciferous vegetables improve glycaemic control compared to root/squash vegetables in a randomized, controlled, crossover trial: The VEgetableS for vaScular hEaLth (VESSEL) study.Diabetes Obes Metab. 2025 Aug;27(8):4300-4310. doi: 10.1111/dom.16467. Epub 2025 May 15. Diabetes Obes Metab. 2025. PMID: 40375391 Free PMC article. Clinical Trial.
-
Protective Role of Lycopene in Subjects with Liver Disease: NUTRIHEP Study.Nutrients. 2024 Feb 18;16(4):562. doi: 10.3390/nu16040562. Nutrients. 2024. PMID: 38398886 Free PMC article.
-
Bioavailability, Human Metabolism, and Dietary Interventions of Glucosinolates and Isothiocyanates: Critical Insights and Future Perspectives.Foods. 2025 Aug 19;14(16):2876. doi: 10.3390/foods14162876. Foods. 2025. PMID: 40870788 Free PMC article. Review.
References
-
- IDF Diabetes Atlas 2015. 7th ed. International Diabetes Federation; Brussels, Belgium: 2015.
-
- Cooper A.J., Forouhi N.G., Ye Z., Buijsse B., Arriola L., Balkau B., Barricarte A., Beulens J.W., Boeing H., Büchner F.L., et al. Fruit and vegetable intake and type 2 diabetes: EPIC-InterAct prospective study and meta-analysis. Eur. J. Clin. Nutr. 2012;66:1082–1092. doi: 10.1038/ejcn.2012.85. - DOI - PMC - PubMed
Publication types
MeSH terms
Substances
Grants and funding
LinkOut - more resources
Full Text Sources
Medical
